
- Title
-
Cereblon Control of Zebrafish Brain Size by Regulation of Neural Stem Cell Proliferation
- Authors
- Ando, H., Sato, T., Ito, T., Yamamoto, J., Sakamoto, S., Nitta, N., Asatsuma-Okumura, T., Shimizu, N., Mizushima, R., Aoki, I., Imai, T., Yamaguchi, Y., Berk, A.J., Handa, H.
- Source
- Full text @ iScience

Thalidomide Retards Brain Development and Causes Microcephaly (A) Head morphology of 72-hpf zebrafish that were grown in the presence of 0.1% DMSO (left), 200 μM thalidomide (middle), or 400 μM thalidomide (right). Thin vertical lines indicate the distance between the rostral-most tip of olfactory bulbs and the temporal-most edge of eyes. Otic vesicles (arrowheads) and pectoral fins (arrows) are also indicated. (B) A schematic diagram depicting body length (black arrow), eye diameter (blue arrow) and head thickness (red arrow) that were used to determine ratios. (C and D) The ratios of eye diameter (blue arrow) in (C) and head thickness (red arrow) in (D) to body length (black arrow) of zebrafish that were grown with or without 400 µM thalidomide were determined and are shown as means ± SEM (n = 20 per group). (E) Primary neurons of 24-hpf embryos that were grown in the presence of 0.1% DMSO or 200 or 400 μM thalidomide. Where indicated, capped mRNA encoding crbnWT or crbnYW/AA was microinjected at the 1-cell stage before thalidomide treatment. Bright-field (BF) (upper panels) and fluorescence (lower panels) images of embryos immunostained with acetylated α-tubulin antibody are shown. Tel, telencephalon; SOC, supraoptic commissure; TPOC, tract of postoptic commissure; PC, posterior commissure. (F) Fluorescence intensity of acetylated α-tubulin-positive neural clusters in telencephalon and TPOC. Fluorescence intensities of the regions indicated with rectangles in (E) were measured and normalized to the intensity of DMSO-treated embryos and are shown as means ± SD (n = 15 per group). (G) Percent incidence of head phenotype (n = 100 per group in a single trial). The head sizes of 72-hpf embryos were classified based on the head-to-body ratio using the following criteria: ≥13%, normal; <13%, small. Scale bar, 50 μm. *p < 0.05, ***p < 0.001.
EXPRESSION / LABELING:
PHENOTYPE:
|
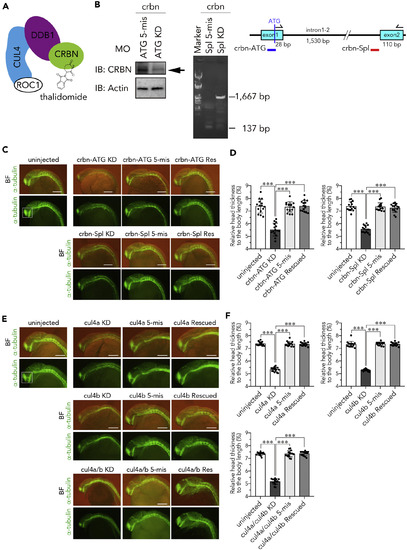
Knockdown of crbn or cul4 Impairs Head Development (A) Schematic structure of CRL4CRBN binding to thalidomide. (B) Immunoblot analysis (left) and RT-PCR analysis (right) of 24-hpf embryos injected with the indicated MOs against crbn. The indicated antibodies were used to analyze embryos injected with the translation-blocking MO. RT-PCR was performed using the indicated primer set to analyze embryos injected with the splice-blocking MO. The target site of the MO is indicated with red bar in the diagram. (C and E) One-cell-stage embryos were left uninjected or injected with the indicated MOs against crbn (C) or cul4 (E) with or without corresponding mRNA and then subjected to immunostaining with anti-acetylated α-tubulin antibody at 24 hpf. Fluorescence images (lower panels) and those overlaid with bright-field images (upper panels) are shown. (D and F) The ratios of head thickness to body length of embryos that were left uninjected or injected with MOs against crbn (D) or cul4 (F) are shown as means ± SD (n = 15 per group). Scale bar, 50 µm. ∗∗∗p < 0.001. |
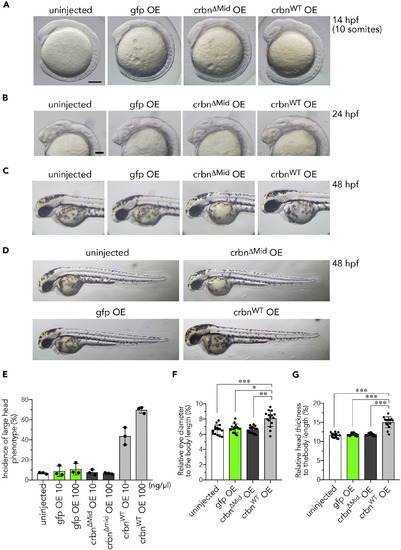
Overexpression of crbn Enlarges the Head (A–D) Head enlargement in crbnWT-overexpressing embryos at the 10-somite stage (14 hpf) (A), 24 hpf (B), and 48 hpf (C and D). One-cell-stage embryos were left uninjected or injected with approximately 300 pg of capped mRNA (300 ng/μL) encoding gfp, crbnΔMid, or crbnWT. (E) One-cell-stage embryos were left uninjected or injected with capped mRNA at the indicated concentration. The head sizes of 14-hpf embryos were classified into “large” and “normal” based on the head-to-body ratio using the following criteria: ≤8%, normal; >8%, large. The fractions of large head embryos are shown as means ± SD (n = 3 per group). (F and G) The ratios of eye diameter (F) and head thickness (G) to body length were determined at 48 hpf as in Figures 1B–1D and are shown as means ± SD (n = 15 per group). Scale bar, 50 μm in (A and B). *p < 0.05, **p < 0.01, ***p < 0.001. |
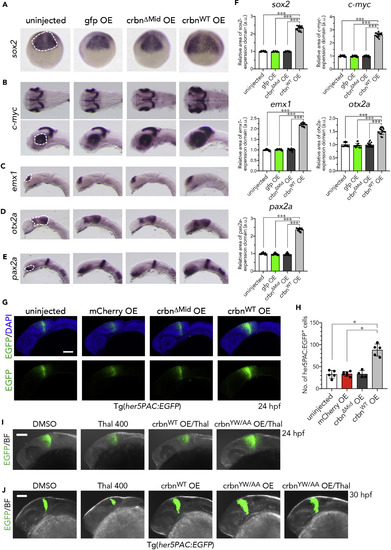
Increased Expression of Brain Marker Genes in crbn-overexpressing Embryos (A–E) In situ hybridization analysis for various brain marker genes in uninjected embryos or those overexpressing gfp, crbnΔMid, or crbnWT. (A) sox2 expression in the anterior brain field at 9 hpf. Dorsal view, anterior to the top. (B) c-mycexpression at 30 hpf in the tectal proliferating zone and in the ciliary marginal zone in retina. Lateral view, anterior to the left. (C) emx1 expression at 20 hpf in dorsal telencephalon. Lateral view, anterior to the left. (D) otx2a expression at 20 hpf in diencephalon. Lateral view, anterior to the left. (E) pax2.1 expression at 20 hpf in optic stalk and MHB. Lateral view, anterior to the left. (F) The areas of expression domains for these genes, indicated with dashed lines in (A) to (E), were measured and normalized to the value of uninjected embryos and are shown as means ± SD. (n = 15 per group). (G) One-cell-stage embryos of her5PAC:egfp transgenic zebrafish were left uninjected or injected with capped mRNA encoding mcherry, crbnΔMid, or crbnWTand then analyzed at 24 hpf. Green fluorescence images (lower panels) and those overlaid with DAPI signals (upper panels) are shown. (H) The number of her5PAC:EGFP-positive cells were counted and are shown as means ± SD (n = 4–6 per group). (I and J) After mRNA microinjection, her5PAC:egfp transgenic embryos were grown in the presence of 0.1% DMSO or 400 μM thalidomide and analyzed at 24 hpf (I) or 30 hpf (J). Green fluorescence images overlaid with bright-field images are shown. Scale bar, 100 μm. *p < 0.05, ***p < 0.001. |
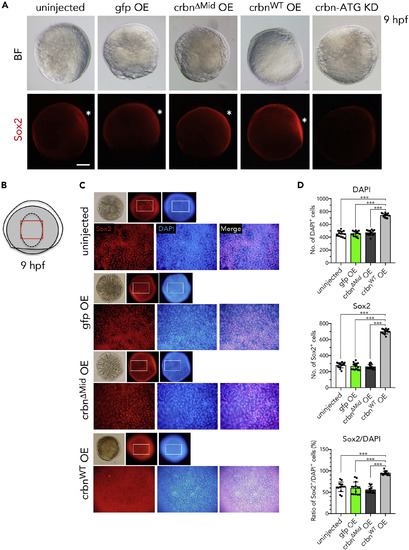
Sox2 Expression in crbn-Overexpressing Embryos (A) Embryos left uninjected or injected with mRNA encoding gfp, crbnΔMid, or crbnWT were immunostained using anti-Sox2 antibody and counterstained with DAPI at 9 hpf. Bright-field (upper panels) and fluorescence (lower panels) images are shown. Animal pole to the top, dorsal side to the right. Dorsal epidermis (the early brain field) is indicated with asterisks. (B) Illustration of 9-hpf embryos. Dorsal epidermis is indicated with dashed line. Lower panels in (C) correspond to the area indicated with red rectangle. (C) Close-up views of the early brain field stained with anti-Sox2 antibody and counterstained with DAPI. (D) Quantification and statistical analysis of the data shown in (C). DAPI-positive cells and Sox2-positive cells in the early brain field of 9-hpf embryos were counted and are shown as means ± SD (n = 15 per group). Scale bar, 150 μm. ***p < 0.001. |
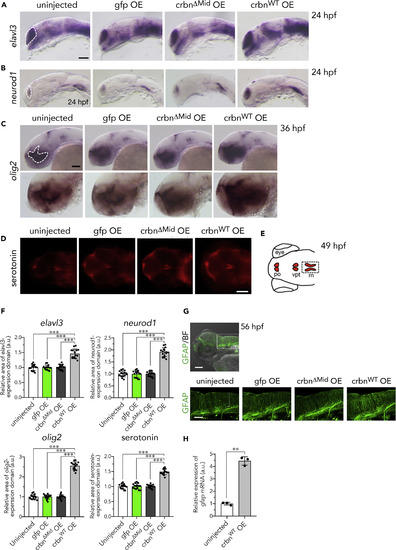
Increase of Neurons, Oligodendrocytes, GFAP-Positive Glia, and Radial Glia in crbn-Overexpressing Larvae (A–C) In situ hybridization analysis of uninjected embryos or those overexpressing gfp, crbnΔMid, or crbnWT. (A) Expression of the neural marker elavl3 (huC) in telencephalon at 24 hpf. (B) Expression of the neural and neural precursor marker neurod1 in telencephalon and lateral longitudinal fascicles at 24 hpf. (C) Expression of the oligodendrocyte marker olig2 in diencephalon at 36 hpf. Upper panels show lower-magnification images, and lower panels show higher-magnification images. (D) 49-hpf larvae immunostained with anti-serotonin antibody. (E) Schematic drawing of serotonin-positive cells at this stage. po, pineal organ; vpt, ventral posterior tubercle; rn, raphe nuclei. (F) The areas of expression domains for elavl3, neurod1, olig2, and serotonin, indicated with dashed lines in (A–C) and (E), were measured and normalized to the value of uninjected embryos and are shown as means ± SD (n = 15 per group). (G) Larvae at 56 hpf immunostained with antibody against the astrocyte marker GFAP. The area surrounded by rectangle in the upper panel is shown in lower panels. The fibers of radial glia are indicated by bracket. (H) Relative amounts of gfap mRNA in 11-hpf embryos were measured by quantitative RT-PCR and are shown as means ± SD (n = 3 per group). Scale bar, 100 μm in (D) and the upper panel in (G) and 50 μm in other panels. **p < 0.01, ***p < 0.001. |

ZFIN is incorporating published figure images and captions as part of an ongoing project. Figures from some publications have not yet been curated, or are not available for display because of copyright restrictions. EXPRESSION / LABELING:
|
|
ZFIN is incorporating published figure images and captions as part of an ongoing project. Figures from some publications have not yet been curated, or are not available for display because of copyright restrictions. PHENOTYPE:
|
|
ZFIN is incorporating published figure images and captions as part of an ongoing project. Figures from some publications have not yet been curated, or are not available for display because of copyright restrictions. PHENOTYPE:
|