FIGURE SUMMARY
Title

Specific inhibition of splicing factor activity by decoy RNA oligonucleotides

Authors
Denichenko, P., Mogilevsky, M., Cléry, A., Welte, T., Biran, J., Shimshon, O., Barnabas, G.D., Danan-Gotthold, M., Kumar, S., Yavin, E., Levanon, E.Y., Allain, F.H., Geiger, T., Levkowitz, G., Karni, R.
Source
Full text @ Nat. Commun.

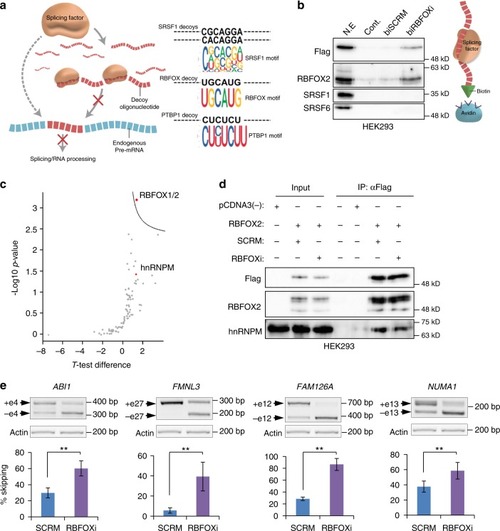
RBFOX1/2 decoy oligonucleotide binds RBFOX2 and affects its splicing targets. a Scheme representing inhibition of RNA binding proteins by decoy oligonucleotides (left panel). Motif sequences of decoy oligonucleotides (black letters) compared to consensus motif sequences of specific splicing factors (colored sequences) (right panel). b Western blot of proteins pulled down with biotin conjugated RBFOXi oligonucleotide (biRBFOXi) or SCRM (biSCRM) using nuclear extracts from HEK293 cells overexpressing RBFOX2. c Volcano plot showing statistically significant proteins pulled down with biotin conjugated RBFOXi, compared to SCRM control, using nuclear extracts from HEK293 overexpressing RBFOX2. d Western blot of HEK293 cells co-transfected with pcDNA3 Flag RBFOX2 and either RBFOXi or SCRM. Cells were fractionated and nuclear extract lysates were used for immunoprecipitation using anti-Flag antibody. Input and IPs were analysed by immunoblotting with the indicated antibodies. e RT-PCR and quantification of known RBFOX1/2 targets in U87MG cells transfected with 2.5 µM of either SCRM or RBFOXi. Gel image of representative experiment is shown above each graph. The same actin control is shown for all panels, as the gels are from the same experiment. **p-value <0.003, calculated using Student's t-test (two-tailed).  Data represent means ± SD of six independent biological samples

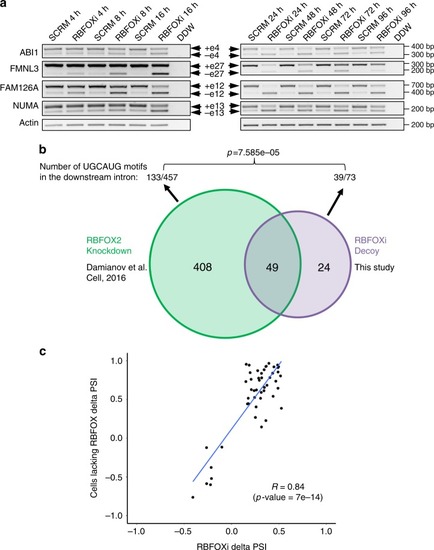
RNA-seq of RBFOXi transfected U87MG cells. a RT-PCR of RBFOX1/2 targets in U87MG cells transfected with 2.5 µM of either RBFOXi or SCRM harvested at the indicated time points. b Venn diagram showing the overlap of exons identified as having altered splicing in RBFOX knockdown cells (green) (as previously reported by Damianov et al. 21) and our RBFOXi treated cells (purple). Number of FRBOX1/2 motifs (UGCAUG) found in the introns downstream of the alternatively spliced exons in each study are shown above the Venn diagram. c Scatter plot showing the correlation of change in splicing (delta PSI) of the 49 significantly alternatively spliced exons detected in both studies (b) (FDR < 0.05)

RBFOX1 RRM interaction with RNAs containing consecutive binding sites using switchSENSE. a Schematic view of hybridization of the DNA/RNA chimeric molecule to the ssDNA covalently attached to the biochip electrodes. The sequences of ssDNA and DNA/RNA molecules are shown. b Sizing experiments performed with 150 nM of RBFOX1 RRM in T40 buffer at 37 °C. Results are shown for the RBFOX1×4 and SCRM×4 DNA/RNA molecules (left side) and a graph shows the apparent size measured with RNA containing one (×1), two (×2), three (×3), and four (×4) consecutive RBFOX1 binding sites (right side). c Titrations performed using switchSENSE on three different electrodes (red, blue and green colors) with increasing concentrations (0.3, 0.6, 1.2, 2.3, 4.7, 9.4, 18.8, 37.5, 75, 150 nM) of RBFOX1 RRM and ×1, ×2, ×3, and ×4 DNA/RNA molecules. Experiments were performed at 37 °C in T100 buffer. KD values obtained from global Langmuir fits are indicated for each interaction with the corresponding standard deviation

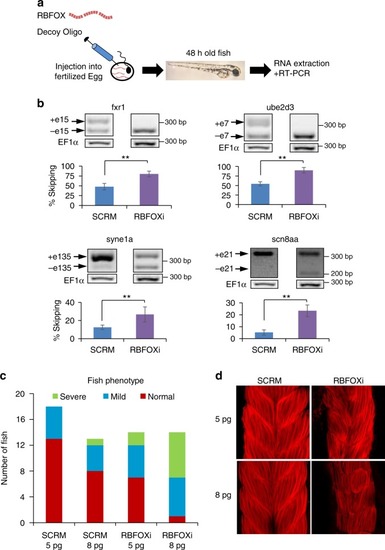
RBFOXi affects alternative splicing and muscle development in zebrafish. a Scheme of experimental design, where either 5pg or 8pg of RBFOXi (or SCRM) were injected to fertilized zebrafish eggs. b RT-PCR of known splicing targets of RBFOX1/2 in 48 h old larva, after injection with 8pg of either SCRM or RBFOXi. RNA was extracted and reverse transcribed from each individual larva. Gel image of a representative experiment is shown above each column. The same EF1α control is shown for all panels, as the gels are from the same experiment **p-value < 0.003, calculated using Student's t-test (two-tailed). Data represent means ± SD of ten zebrafish samples. c Quantification of phenotype severity 48 h post fertilization after injection with either SCRM or RBFOXi (5pg, 8pg). Phenotypes were assigned by visualization of fiber formation and segmental structures. d Pictures of phalloidin staining of F-actin fibers in fish tails 48 h post fertilization after injection with 8pg of either SCRM or RBFOXi

PTBP1 decoy oligonucleotides inhibit its splicing and biological activities in breast cancer cells. a Western blot of proteins pulled down with biotin conjugated PTBP1i (biPTBP1i) or SCRM (biSCRM) using HEK293 nuclear extracts. b Volcano plot showing statistically significant proteins pulled down with biotin conjugated PTBP1i, compared to SCRM control, using HEK293 nuclear extracts. c RT-PCR and quantification of known PTBP1 splicing targets in MDA-MB-231 cells 48 h after transfection with either 5 µM biSCRM or biPTBP1 oligonucleotides. **p-value <0.0008. Data represent means ± SD of five independent biological samples. d Proliferation assay of MDA-MB-231 cells transfected as in c. Four hours after transfection 4000 cells/well were seeded in six replicates. **p-value <0.0002 for all time points. Data represent means ± SD of six replicates. e Clonogenic assay of MDA-MB-231 cells transfected as in c plated at different densities (250, 500, or 1000 cells/well). n = 2. Data represent means ± SD of duplicate wells. f Soft agar colony growth assay on MDA-MB-231 cells transfected as in c. Graphs represent quantification of 10 fields counted in duplicate (total of 20 fields). **p-value <1.7E−27. Data represent means ± SD of two wells. p-values were calculated using Student's t-test (two-tailed)

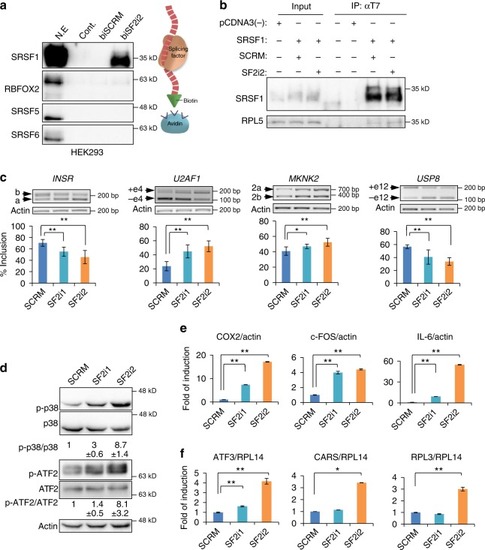
SRSF1 decoy oligonucleotides inhibit splicing and biological functions in glioblastoma cells. a Western blot of proteins pulled down with biotin conjugated SF2i2 (biSF2i2) or SCRM (biSCRM) using nuclear extracts from HEK293 cells overexpressing SRSF1. b Western blot of HEK293 cells co-transfected with pcDNA3 T7 SRSF1 and either SF2i2 or SCRM. Cells were fractionated and nuclear extract lysates were used for immunoprecipitation using anti-T7 antibody. Input and IPs were analysed by immunoblotting with the indicated antibodies. c RT-PCR and quantification of known splicing targets of SRSF1 in U87MG cells transfected with 2.5 µM of either SCRM, SF2i1, or SF2i2. Data represent means ± SD of six biological samples. d Western blot analysis of lysates from cells described in c. Data represent means ± SD of three biological samples. e RT-qPCR of p38 pathway target genes in cells described in c. Data represent means ± SD of triplicates. f RT-qPCR of NMD targets in cells described in c. *p-value ≤0.05, **p-value <0.004. Data represent means ± SD of triplicates. p-values were calculated using Student's t-test (two-tailed)

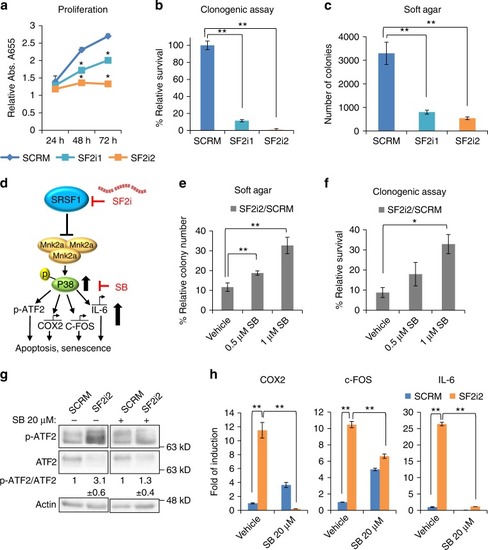
Inhibition of glioblastoma cells by SRSF1 decoys is partially reversed by SB203580. a Proliferation assay of U87MG cells after transfection with 2.5 µM of indicated decoy oligonucleotides. Four hours after transfection 4000 cells/well were seeded in six replicates. *p-value ≤0.02 for SF2i2 at 24 h, **p-value ≤0.0004 at 48 and 72 h. Data represent means ± SD of six replicates. b Graph of clonogenic assay (1000 cells/well) of transfected cells described in a. **p-value <0.003. Data represent means ± SD of four independent biological samples. c Quantification of soft agar colony growth assay on transfected cells described in a. Graphs represent quantification of 10 fields counted in duplicate (total of 20 fields). **p-value <1.1E–17. Data represent means ± SD of two wells. d Scheme representing SRSF1 effects on the p38-MAPK signaling pathway. SF2i1/SF2i2 oligonucleotides (SF2i), SB203580 (SB). e Quantification of soft agar colony growth assay on transfected cells described in a treated with the indicated concentrations of SB. Relative survival is based on quantification of 10 fields counted in duplicate (total of 20 fields). **p-value <0.002. Data represent means ± SD of two wells. f Quantification of clonogenic assay of cells described in a treated with the indicated concentrations of SB. *p-value = 0.02. Data represent means ± SD of duplicates. g Western blot analysis of cells described in e. Quantification of SF2i2 + vehicle is normalized to SCRM + vehicle, and SF2i2 + SB is normalized to SCRM + SB. Data represent means ± SD of four biological samples. h RT- qPCR of p38 pathway targets in cells described in e. Values are normalized to actin and SCRM without vehicle is arbitrarily set at 1. *p-value = 0.02, **p-value ≤0.003. Data represent means ± SD of triplicates. p-values were calculated using Student's t-test (two-tailed)

SRSF1 decoy oligonucleotides inhibit glioblastoma tumor growth in mice. a mCherry-labeled U87MG cells transfected with either SCRM or SF2i2 decoy oligos were injected intracranially into the striatum on both sides of the brain. Twenty-one days after injection the mice were sacrificed and brains were photographed using a fluorescent dissecting microscope. b Cy3 imaging. Exposure time was 500 ms. c Bright field photos (BF)

Acknowledgments
This image is the copyrighted work of the attributed author or publisher, and ZFIN has permission only to display this image to its users. Additional permissions should be obtained from the applicable author or publisher of the image. Full text @ Nat. Commun.