
- Title
-
Roles of basal keratinocytes in actinotrichia formation
- Authors
- Kuroda, J., Iwane, A.H., Kondo, S.
- Source
- Full text @ Mech. Dev.
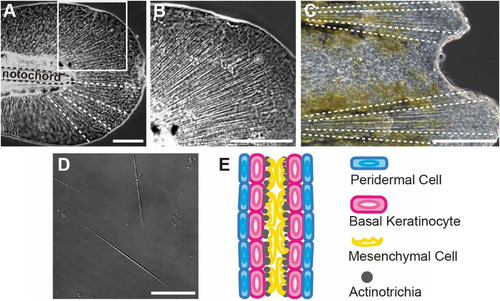
The distribution pattern of actinotrichia in zebrafish fin. (A) Phase contrast image of the median fin fold in larva at 3 days post-fertilization (dpf). Actinotrichia are radially distributed throughout the whole fin. (B) Magnified view of the box region in (A). (C) Distal tip of the adult caudal fin. Actinotrichia radially extend from the edge of each fin-ray to distal fin tip. White dot lines in (A and C) indicate actinotrichia orientation. (D) Confocal image of the actinotrichia isolated from larval fin. (E) Schematic diagram of the transverse section at the very tip of fin modified from Dane and Tucker (1985) and Wood and Thorogood (1987). Actinotrichia are located inside the epidermis constituted by two epidermal cell layers. Scale bar is 100 μm in (A–C) and 50 μm in (D). |
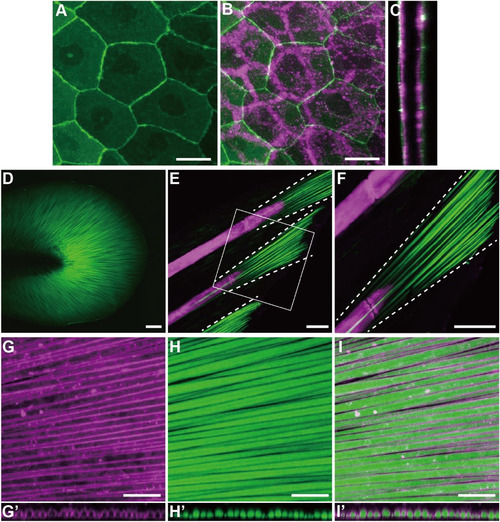
In vivo visualization of basal keratinocytes and actinotrichia. (A) Peridermal cells expressing GFP-CaaX under the keratin4 promoter. (B) Merged image with (A) and basal keratinocyte expressing mCherry-CaaX under the and1 promoter. (C) Transverse section image of (B). (D–F) Fluorescence images of the visualized actinotrichia by And1480bp-GFP. (D) The median fin fold in the larva 6 days post-fertilization (dpf). (E) The tip of caudal fin in 3-week-old fish. (F) The magnified image of white box in (E). Fin skeleton was stained by alizarin red (magenta). Each actinotrichia extended from the tip of fin-rays. The white dot lines show the actinotrichia orientation. (G) Immunofluorescence against Collagen II. (H) GFP fluorescence of the visualized actinotrichia by And1480bp-GFP. (I) Merged image with (G) and (H). (G′), (H′) and (I′) Optical cross section images in (G), (H) and (I), respectively. Note that both of immunofluorescence against Collagen II and GFP fluorescence of And1480bp-GFP are detected in all actinotrichia (G–I′). Scale bar is 50 μm in (A–F) and 20 μm in (G–I). (For interpretation of the references to color in this figure legend, the reader is referred to the web version of this article.) |
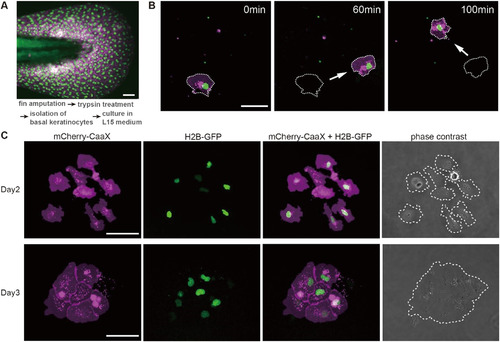
Primary culture of the basal keratinocytes from the reporter zebrafish expressing fluorescent proteins at larval stage. (A) Median fin fold of larva at 3 days post-fertilizations (dpf) expressing histone H2B-GFP which can visualize the nucleus and mCherry-CaaX in the basal keratinocytes. Basal keratinocytes were isolated from the median fin fold by the trypsin treatment and cultured in the L15 medium. (B) Time-lapse images of basal keratinocytes. White arrow indicates the direction of basal keratinocyte movement. (C) Basal keratinocytes can self-assemble and form colonies. The images on the top row show 8 basal keratinocytes which were separated one another after 2 days in culture. The images on the bottom row show a colony that consists of 8 basal keratinocytes at 3 days after culture. White dot lines show the shape of a cell or a colony. Scale bar is 50 μm (A–C). |
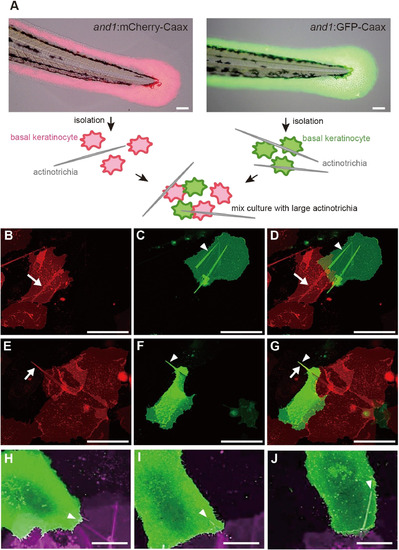
In vitro holding of the long mature actinotrichia by the basal keratinocytes from two reporter lines. (A) Schematic diagram of the mix-culture experiment using two types of reporter zebrafish. Scale bar is 50 μm. (B–J) The cultured basal keratinocytes in vitro from the larvae of and1:mCherry-CaaX and and1:GFP-CaaX. (B) White arrow indicates the actinotrichium in the basal keratinocyte expressing mCherry-Caax. (C) White arrowhead indicates the actinotrichium in the basal keratinocyte expressing GFP-CaaX. (E) White arrow indicates the actinotrichium protruded from a basal keratinocyte were enveloped by a mCherry-CaaX-expressing basal keratinocyte. (F) White arrowhead indicates GFP-CaaX-expressing basal keratinocyte. (D and G) Merged image of (B and C) and (E and F), respectively. Two adjacent basal keratinocytes share the same actinotrichia. Scale bar in (B − G) is 50 μm. (H–J) Time-lapse images of the plasma membrane enveloping the actinotrichium. White arrowheads indicate the actinotrichium enveloped by two adjacent basal keratinocytes. Scale bar in (H–J) is 20 μm. |
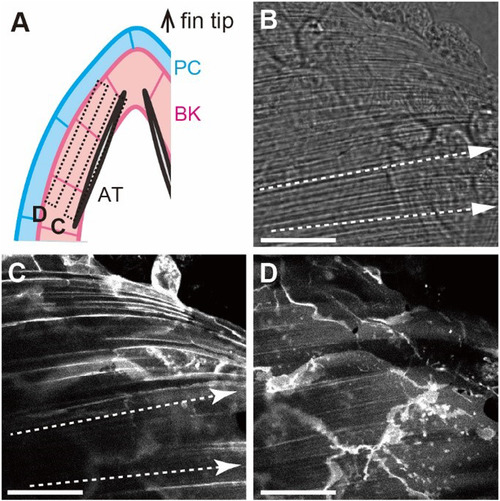
In vivo orientation of the basal keratinocyte membrane in the larval fin. (A) Schematic of the horizontal section of larval fin. The top shows the fin tip and the two boxed regions correspond to the cross section of (C) and (D). AT, BK, and PC correspond actinotrichia, basal keratinocyte and peridermal cell respectively. (B) Phase contrast image of the fin tip in. |
Reprinted from Mechanisms of Development, 153, Kuroda, J., Iwane, A.H., Kondo, S., Roles of basal keratinocytes in actinotrichia formation, 54-63, Copyright (2018) with permission from Elsevier. Full text @ Mech. Dev.