FIGURE SUMMARY
Title

Inhibition of Classical and Alternative Modes of Respiration in Candida albicans Leads to Cell Wall Remodeling and Increased Macrophage Recognition

Authors
Duvenage, L., Walker, L.A., Bojarczuk, A., Johnston, S.A., MacCallum, D.M., Munro, C.A., Gourlay, C.W.
Source
Full text @ MBio

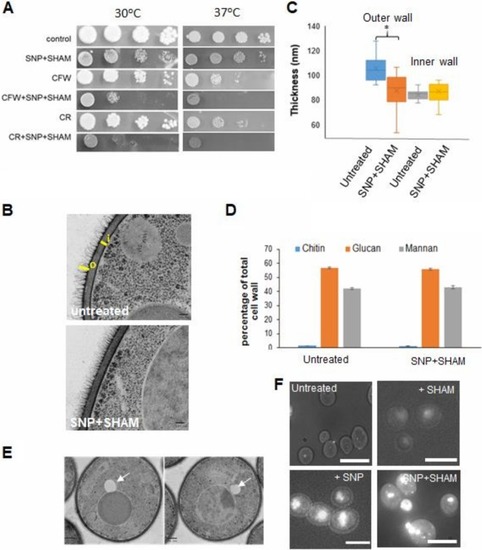
SNP+SHAM treatment leads to cell wall alterations and altered lipid metabolism. (A) Wild-type cells were serially diluted (1:10 dilutions), and equal volumes were spotted onto YPD plates (at 30 or 37°C) containing 1 mM SNP–0.5 mM SHAM and 25 µg/ml calcofluor white (CFW) or 40 µg/ml Congo red (CR). (B) Cells were treated with 1 mM SNP–0.5 mM SHAM for 18 h and processed for transmission electron microscopy (TEM). Representative examples of untreated and SNP+SHAM-treated cells are shown. Bar = 100 nm. (C) Quantification of outer cell wall (o) and inner cell wall (i) thicknesses was carried out from TEM images. Measurements were taken at 5 points along the cell wall for 25 cells per group. Bar = 100 nm. (D) Cell wall material was extracted and acid hydrolyzed from cells treated with 1 mM SNP–0.5 mM SHAM for 18 h, followed by HPLC analysis (n = 3). Graphs show means ± standard deviations. (E) TEM images from cells treated with SNP+SHAM. Arrows indicate lipid droplets. Bar = 500 nm. (F) Control and SNP-, SHAM-, or SNP+SHAM-treated cells were stained using LD540 neutral lipid stain and viewed by fluorescence microscopy. Bar = 10 µm. Student's t test was used to compare groups. *, P < 0.01.

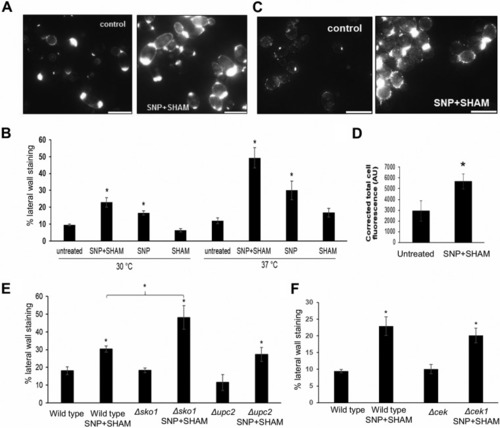
SNP+SHAM treatment induces surface exposure of chitin and β(1,3)-glucan. (A) Representative examples of untreated cells and cells treated with 1 mM SNP–0.5 mM SHAM for 18 h, stained with fluorescein isothiocyanate (FITC)-wheat germ agglutinin (WGA), and analyzed using fluorescence microscopy. (B) Cells treated with SNP, SHAM, or SNP+SHAM at 30 or 37°C were quantified for FITC-WGA staining as described in Materials and Methods (n = 3). (C) Representative examples of untreated and SNP+SHAM-treated cells stained with dectin-1. Bar = 10 µm. (D) Cells were quantified as described in Materials and Methods (n = 3). AU, arbitrary units. (E and F) Effect of SNP+SHAM treatment on chitin unmasking as determined by WGA staining in upc2Δ and sko1Δ mutants (E) and in (F) cek1Δ mutants. Graphs show means ± standard deviations. At least three independent experiments were performed for each analysis. Student's t test was used to compare groups. *, P < 0.001.

C. albicans pretreated with SNP+SHAM showed increased uptake by murine macrophages and by zebrafish macrophages in vivo. (A) Wild-type cells were treated with 1 mM SNP–0.5 mM SHAM for 18 h and then washed in phosphate-buffered saline (PBS) and coincubated with J774.1 murine macrophages (3:1 C. albicans/macrophage ratio). Representative examples of uptake after 1 h coincubation are shown. (B) Uptake of cells treated with SNP, SHAM, or SNP+SHAM was quantified by counting at least 200 C. albicans cells per experiment. *, P < 0.001. Five independent experiments were carried out. The percentage of uptake was determined as the number of internalized C. albicans cells relative to the total number of C. albicans cells. (C) Wild-type GFP-labeled C. albicans cells were treated with 1 mM SNP–0.5 mM SHAM for 18 h, washed, and injected into zebrafish larvae. A representative microscopy image of C. albicans (green) being taken up by macrophages (red) in vivo is presented (1, phagocytosed C. albicans; 2, single C. albicans cell; 3, single macrophage). (D) Proportions of phagocytosed C. albicans cells were calculated from images taken from three independent experiments (n = 3). *, P < 0.01. Graphs show means ± standard deviations. Student's t test was used to compare groups.

Pretreatment of C. albicans increases virulence in the mouse model and leads to more-rapid filamentation. (A) C. albicans cells were treated with SNP+SHAM for 18 h and then washed in PBS prior to injection via the tail vein. Weight loss, fungal burden, and outcome score were calculated as described in Materials and Methods. *, P < 0.05. (B) Cross-section from kidney infected with untreated wild-type or SNP+SHAM-pretreated cells, both stained with hematoxylin and eosin (Hem + Eos; bar, 50 µm) to emphasize locations of immune infiltration (white arrows) or periodic acid-Schiff reagent (PAS; bar, 20 µm) to highlight C. albicanscells (black arrows). (C) Wild-type cells were treated with 1 mM SNP–0.5 mM SHAM for 18 h and then washed in PBS and transferred to serum-containing medium at 37°C. Representative examples of filamentation in wild-type untreated and SNP+SHAM-pretreated cells after 90 min. (D) The percentages of filamentous cells were calculated in cells pretreated with SNP, SHAM, or SNP+SHAM, washed, and grown for 90 min as described for panel C (n = 3). (E) Wild-type and aox2Δ aox1Δ mutant cells were treated with 1 mM SNP–0.5 mM SHAM for 18 h and then washed in PBS and transferred to serum-containing medium at 37°C for 90 min before assessment. Graphs show means ± standard deviations. Three independent experiments were performed for each analysis. Student's t test was used to compare groups. *, P < 0.01.

Acknowledgments
This image is the copyrighted work of the attributed author or publisher, and ZFIN has permission only to display this image to its users. Additional permissions should be obtained from the applicable author or publisher of the image. Full text @ MBio