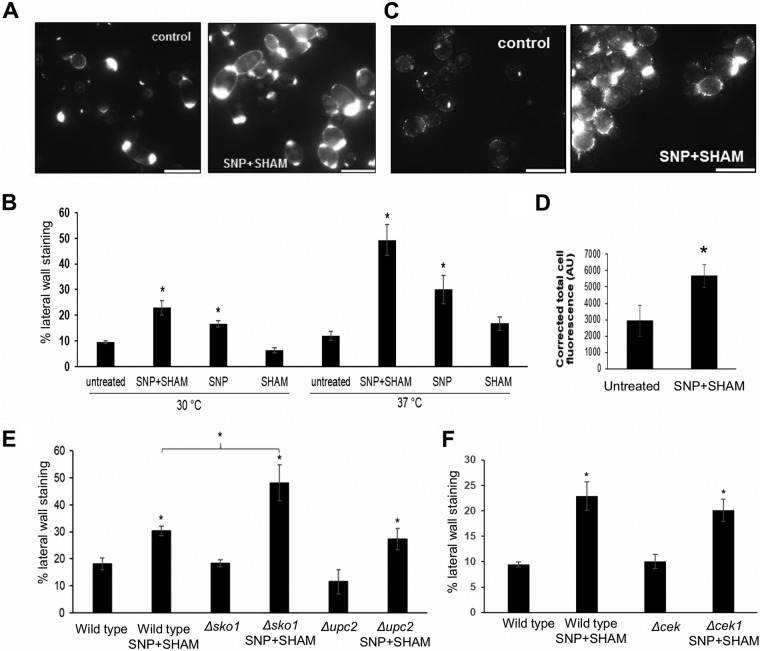
IMAGE

FIG 5

ID
ZDB-IMAGE-190723-1955
Source
Figures for Duvenage et al., 2019
Image
Figure Caption

FIG 5

SNP+SHAM treatment induces surface exposure of chitin and β(1,3)-glucan. (A) Representative examples of untreated cells and cells treated with 1 mM SNP–0.5 mM SHAM for 18 h, stained with fluorescein isothiocyanate (FITC)-wheat germ agglutinin (WGA), and analyzed using fluorescence microscopy. (B) Cells treated with SNP, SHAM, or SNP+SHAM at 30 or 37°C were quantified for FITC-WGA staining as described in Materials and Methods (n = 3). (C) Representative examples of untreated and SNP+SHAM-treated cells stained with dectin-1. Bar = 10 µm. (D) Cells were quantified as described in Materials and Methods (n = 3). AU, arbitrary units. (E and F) Effect of SNP+SHAM treatment on chitin unmasking as determined by WGA staining in upc2Δ and sko1Δ mutants (E) and in (F) cek1Δ mutants. Graphs show means ± standard deviations. At least three independent experiments were performed for each analysis. Student's t test was used to compare groups. *, P < 0.001.

Acknowledgments
This image is the copyrighted work of the attributed author or publisher, and ZFIN has permission only to display this image to its users. Additional permissions should be obtained from the applicable author or publisher of the image. Full text @ MBio