
- Title
-
A Genetically Encoded Fluorescent Sensor for Rapid and Specific In Vivo Detection of Norepinephrine
- Authors
- Feng, J., Zhang, C., Lischinsky, J.E., Jing, M., Zhou, J., Wang, H., Zhang, Y., Dong, A., Wu, Z., Wu, H., Chen, W., Zhang, P., Zou, J., Hires, S.A., Zhu, J.J., Cui, G., Lin, D., Du, J., Li, Y.
- Source
- Full text @ Neuron
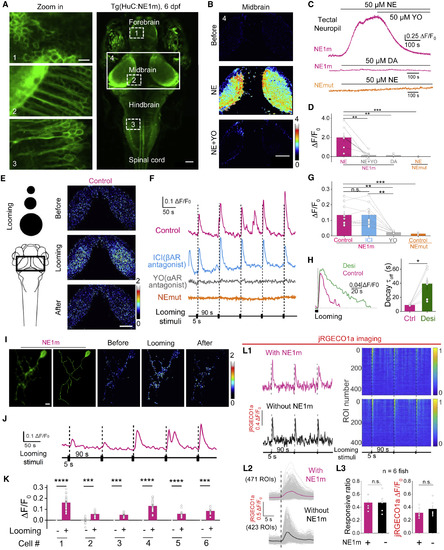
GRABNE Can Be Used to Measure Noradrenergic Activity In Vivo in Transgenic Zebrafish (A) In vivo confocal image of a Tg(HuC:GRABNE1m) zebrafish expressing GRABNE1m in neurons driven by the HuC promoter. Larvae at 6 days post-fertilization were used. (B–D) Bath application of NE (50 μM), but not DA (50 μM), elicits a significant increase in fluorescence in the tectal neuropil of Tg(HuC:GRABNE1m) zebrafish, but not in GRABNEmut zebrafish, and this increase is blocked by YO (50 μM), but not ICI 118,551 (50 μM). Pseudocolor images (B), raw traces (C), and statistical results (D) are shown. n = 7. (E–H) Visual looming stimuli evoke the release of endogenous NE in the midbrain of GRABNE1m zebrafish, but not in GRABNEmut zebrafish. The looming stimuli paradigm is shown in the left of (E). Raw traces (F) and statistical results (G) are shown. Where indicated, YO (50 μM) or ICI 118,551 (50 μM) was applied. Desipramine (Desi, 50 μM) application slowed the decay of looming-induced NE release (H). n = 6 for GRABNEmut and n = 9 for the others. (I–K) Single-cell labeling of GRABNE1m in the midbrain of zebrafish larva (I), with looming-evoked responses shown in (I) and (J). The summary data for 6 labeled cells are shown in (K). (L) Looming-evoked calcium responses of optic tectal neurons reported by jRGECO1a show no difference with or without HuC:GRABNE1moverexpression. Exemplar traces of looming-evoked responses of single tectal neurons are shown (L1, left). Responsive neurons sorted as descending amplitudes are shown (L1, right). 20 s before each stimulus as the baseline is shown. Averaged looming-evoked jRGECO1a responses of every neuron (L2, gray lines) and the averaged responses of all neurons (L2, red line and black line, respectively) are shown. The responsive ratio and averaged amplitude of every fish are shown in (L2). n = 6. The scale bar shown in (A, left) represents 10 μm; the scale bars shown in (A, right), (B), and (E) represent 50 μm. The scale bar shown in (I) represents 5 μm. ∗p < 0.05, ∗∗p < 0.01, ∗∗∗p < 0.001, and ∗∗∗∗p < 0.0001 (Wilcoxon matched-pairs signed rank test in H; all others were analyzed using the paired or unpaired Student’s t test). |
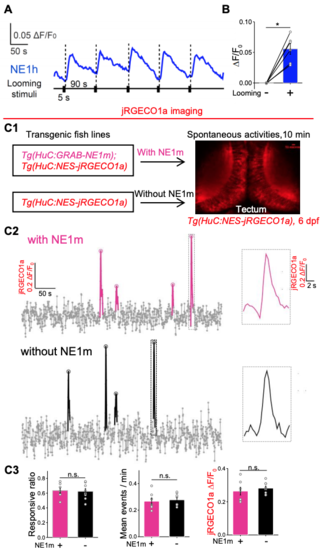
GRABNE1h can sense endogenous NE release and optic tectal neurons 132 with or without HuC:GRABNE1m overexpression show no difference in spontaneous 133 calcium responses, related to Figure 5. 134 (A,B) Detection of endogenous NE release in the midbrain of GRABNE1h zebrafish 135 evoked by visual looming stimuli. Quantification data is shown in (B). n = 6 fish. 136 (C) Spontaneous calcium activities of optic tectal neurons revealed by jREGCO1a 137 fluorescent signals show no difference with- or without HuC:GRABNE1m expression. 138 Experimental diagram is shown in (C1). Traces for representative calcium responses are 139 shown in (C2). Group data are shown in (C3). n = 7 for transgenic HuC:GRABNE1m 140 zebrafish, and n = 8 for fish without expressing GRABNE1m. 141 142 *p< 0.05 and ***p< 0.001; n.s., not significant (Student’s t-test, Wilcoxon test, or Mann143 Whitney rank sum test). |