
- Title
-
A Smart Imaging Workflow for Organ-Specific Screening in a Cystic Kidney Zebrafish Disease Model
- Authors
- Pandey, G., Westhoff, J.H., Schaefer, F., Gehrig, J.
- Source
- Full text @ Int. J. Mol. Sci.
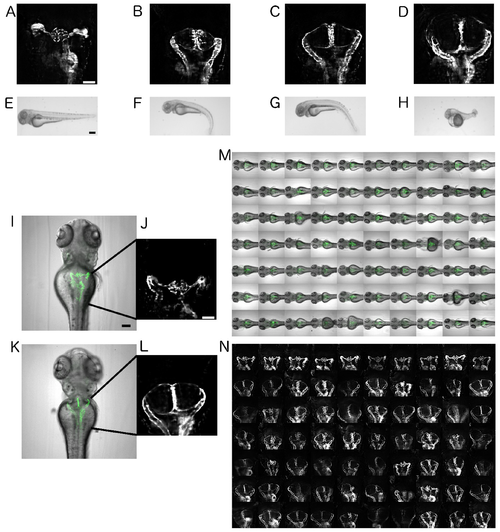
Automated imaging of an ift172-MO-based zebrafish model for human cystic kidney disease. (A–D) Dorsal views on pronephric areas in the Tg(wt1b:EGFP) embryos. Scale bar is 50 µm. (E–H) Bright-field stereo microscope images of the dose–response curve of ift172-MO on 72 hpf zebrafish larvae. Scale bar is 250 µm. (A,E) wild-type, (B,F) 50 µM ift172-MO, (C,G) 100 µM ift172-MO, and (D,H) 500 µM ift172-MO. (I,K) Overlay images of bright-field and fluorescence channels depicting wild-type and cystic pronephric phenotypes acquired with a 10x objective. Scale bar for I is 100 µm and J is 50 µm. (J,L) Enlarged fluorescent 10x views of I and K. (M,N) Montage images illustrating (M) overlay images or (N) pronephric areas of dorsally oriented larvae in a microtiter plate. EXPRESSION / LABELING:
PHENOTYPE:
|
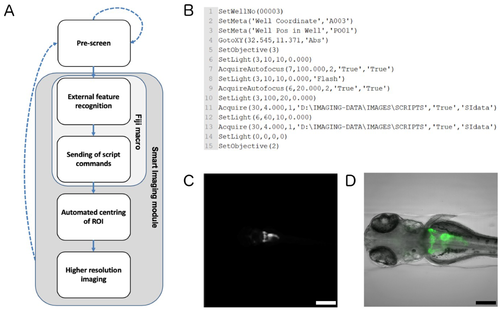
Smart imaging workflow for automated imaging of kidney regions. (A) Workflow chart illustrating the feedback microscopy approach utilised to automatically acquire regions of interest (ROIs). Dotted arrows indicate imaging components of the pre-screen; solid arrows indicate image processing and higher resolution imaging procedures of the smart imaging module. (B) Example of script commands for a single well that are sent to the automated microscope. The script triggers automated centring of the region of interest and high-resolution acquisition. (C) Representative overview image taken with 4x objective followed by (D) centring and higher resolution imaging of the pronephric region with 10x objective. The image shows a maximum projection of the GFP channel overlaid with the bright-field channel. Scale bar in C is 500µm and scale bar in D is 200 µm. |
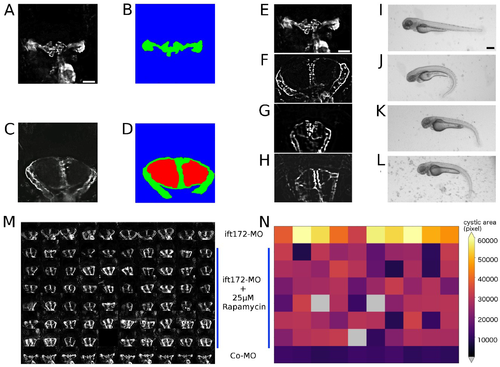
Automated scoring of pronephric phenotypes. (A–D) Quantification of pronephric tissue and cystic area in the controls (A,B) and cystic kidneys (C,D) acquired with 10x objective. Green depicts GFP-positive pronephric tissue, and red depicts cystic area. Scale bar for A–D is 50 µm. (E,F) Fluorescence and stereo microscope images of dose–response experiments administering rapamycin Co-MO or ift172-MO-injected embryos at 72 hpf. (E,I) The control, (F,J) ift172-MO injected, (G,K) ift172-MO + 25 µM rapamycin-exposed and (H,L) ift172-MO + 50 µM rapamycin-exposed larvae are shown. Scale bar for E–H is 50 µm and for I–L is 250 µm. (M) Montage representing 72 hpf pronephros in a microtiter plate; the first row is ift172-MO injected, last row is wild type and rest of the rows are 25 µM rapamycin-exposed larvae. (N) The corresponding heatmap displays rapamycin-based suppression of kidneys in reference to the cystic (first row) and wild-type (last row) controls. EXPRESSION / LABELING:
PHENOTYPE:
|