
- Title
-
Reverse genetic screen reveals that Il34 facilitates yolk sac macrophage distribution and seeding of the brain
- Authors
- Kuil, L.E., Oosterhof, N., Geurts, S.N., van der Linde, H.C., Meijering, E., van Ham, T.J.
- Source
- Full text @ Dis. Model. Mech.
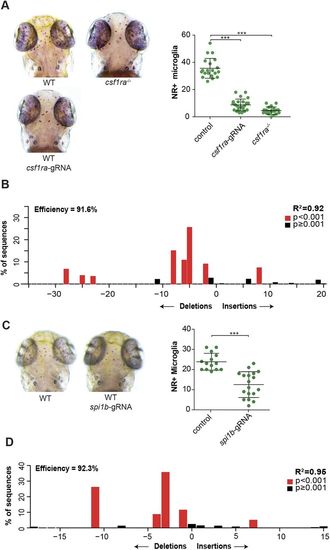
csf1r CRISPants phenocopy existing csf1r microglia mutants. (A) Neutral Red (NR+) images and quantification of wild-type (WT), csf1ra−/− and csf1ra CRISPant zebrafish larvae at 3 dpf. (B) Indel spectrum of a pool of csf1ra CRISPants calculated by TIDE. (C) NR images and quantification of WT and spi1b CRISPant zebrafish larvae at 3 dpf. (D) Indel spectrum of a representative individual spi1b CRISPant calculated by TIDE. The R2 value represents reliability of the indel spectrum. ***P<0.001. One-way ANOVA and Student's t-test. Each dot represents one larva. Error bars represent s.d. PHENOTYPE:
|
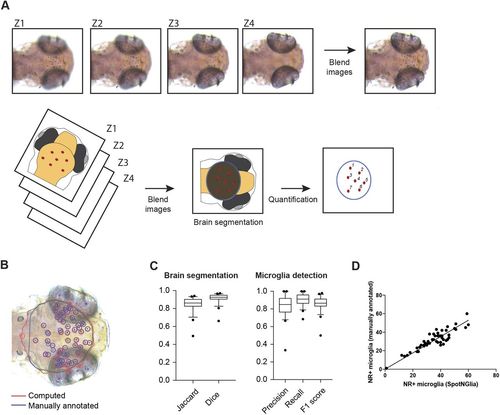
SpotNGlia semi-automatically counts microglia numbers. (A) Examples of z-stack images of NR-stained larvae and a schematic representation of the SpotNGlia analysis pipeline. (B) SpotNGlia output of test dataset with both manual (blue) and automated (red) brain segmentation and NR+ microglia annotation. (C) Box plots showing Jaccard and Dice indices for accuracy of brain segmentation and F1, precision and recall scores for the accuracy of NR+microglia annotation. This is a Tukey boxplot: it uses the median and interquartile range (IQR) for the box. The whiskers extend to the most extreme data within 1.5×IQR. Data outside 1.5×IQR are considered outliers. (D) Correlation between manually and automated microglia quantification after manual correction for segmented brain area. Error bars represent s.d. |
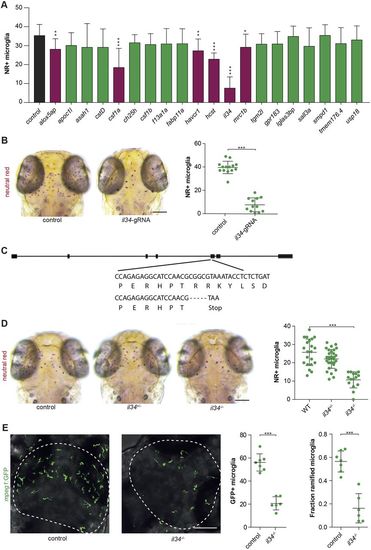
Reverse genetic screen reveals zebrafish il34 as a regulator of microglia development. (A) Accumulated data from all gRNA injections showing the number of NR+microglia as quantified with SpotNGlia. Magenta bars represent genes showing a significant reduction in microglia numbers upon CRISPR/Cas9-based targeting (black bar, control; green bars, genes with non-significant reduction in microglia numbers). (B) NR+ microglia numbers in 3 dpf zebrafish larvae injected with gRNA-Cas9 RNPs targeting il34. Controls in A and B are non-injected WT larvae. (C) A −5 bp deletion in exon 1 of il34 directly introduces a stop codon. (D) NR+microglia numbers in il34 mutants with a premature stop codon in exon 5 and their heterozygous and WT siblings at 3 dpf. (E) GFP+ microglia in the optic tecti (dashed lines) of 3 dpf il34 mutants and controls, and quantification of their numbers and the fraction of microglia containing more than one protrusion (ramified microglia). Controls in D and E are WT (il34+/+) larvae. *P<0.05, **P<0.01, ***P<0.001. One-way ANOVA and Student's t-test. Bonferroni correction for multiple testing. Scale bars: 100 µm. Each dot represents one larva. Error bars represent s.d. EXPRESSION / LABELING:
PHENOTYPE:
|
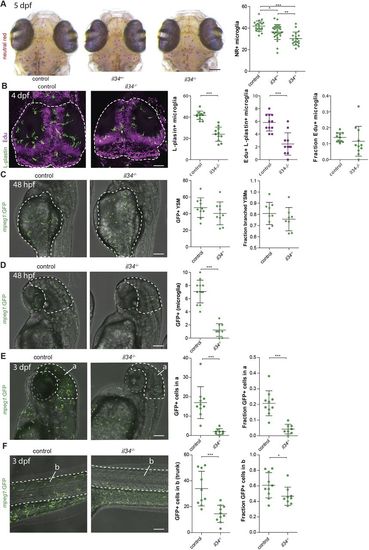
Il34 does not affect proliferation but does affect the distribution of YSMs to target organs. (A) NR+ microglia numbers in il34 mutants and their heterozygous and WT siblings at 5 dpf. (B) EdU/L-plastin staining of microglia in the optic tecti (dashed lines) of 4 dpf il34 mutants and WT controls, and quantification of microglia numbers, EdU+ microglia numbers and the fraction of EdU+ microglia among total numbers. (C) In vivo imaging of GFP+macrophages located on the yolk sac (dashed lines) in il34 mutants and WT controls, transgenic for mpeg1-GFP, and quantification at 48 hpf. YSMs with more than one protrusion were counted as branched YSMs. (D) In vivo imaging of mpeg1-GFP+ macrophages located in the head region (dashed lines) in il34 mutants and WT controls, and quantification at 48 hpf. (E) In vivo imaging of GFP+ macrophages located in the head region (dashed lines) in il34 mutants and WT controls, and quantification at 3 dpf. a, outline of the head region. (F) In vivo imaging of mpeg1-GFP+macrophages located in the tail (dashed lines) in il34 mutants and WT controls, and quantification. b, outline of the embryonic region/trunk region. Scale bars: 100 µm. *P<0.05, **P<0.01, ***P<0.001. One-way ANOVA and Student's t-test. Each dot represents one larva. Error bars represent s.d. EXPRESSION / LABELING:
|

ZFIN is incorporating published figure images and captions as part of an ongoing project. Figures from some publications have not yet been curated, or are not available for display because of copyright restrictions. PHENOTYPE:
|
|
ZFIN is incorporating published figure images and captions as part of an ongoing project. Figures from some publications have not yet been curated, or are not available for display because of copyright restrictions. |