
Image
|
Figure Caption
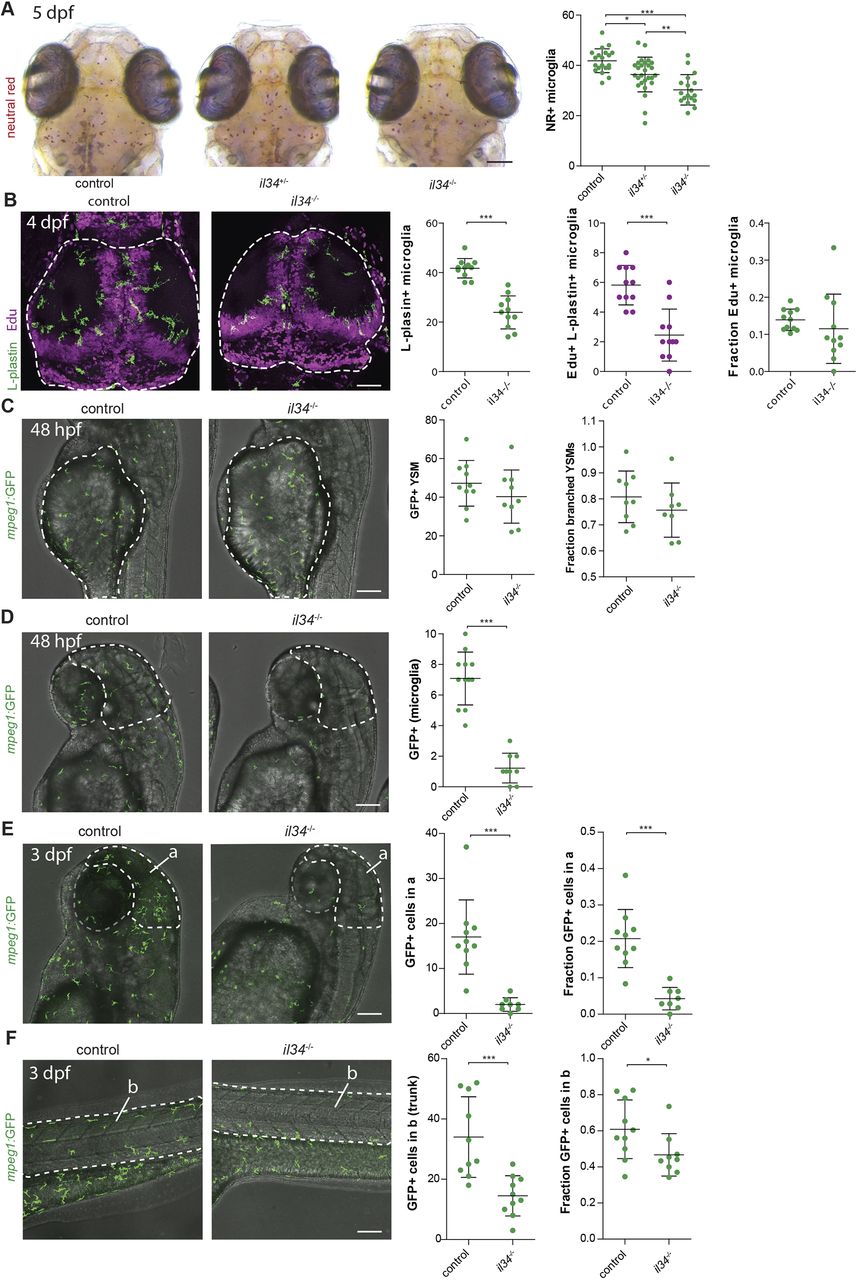
Fig. 4
Il34 does not affect proliferation but does affect the distribution of YSMs to target organs. (A) NR+ microglia numbers in il34 mutants and their heterozygous and WT siblings at 5 dpf. (B) EdU/L-plastin staining of microglia in the optic tecti (dashed lines) of 4 dpf il34 mutants and WT controls, and quantification of microglia numbers, EdU+ microglia numbers and the fraction of EdU+ microglia among total numbers. (C) In vivo imaging of GFP+macrophages located on the yolk sac (dashed lines) in il34 mutants and WT controls, transgenic for mpeg1-GFP, and quantification at 48 hpf. YSMs with more than one protrusion were counted as branched YSMs. (D) In vivo imaging of mpeg1-GFP+ macrophages located in the head region (dashed lines) in il34 mutants and WT controls, and quantification at 48 hpf. (E) In vivo imaging of GFP+ macrophages located in the head region (dashed lines) in il34 mutants and WT controls, and quantification at 3 dpf. a, outline of the head region. (F) In vivo imaging of mpeg1-GFP+macrophages located in the tail (dashed lines) in il34 mutants and WT controls, and quantification. b, outline of the embryonic region/trunk region. Scale bars: 100 µm. *P<0.05, **P<0.01, ***P<0.001. One-way ANOVA and Student's t-test. Each dot represents one larva. Error bars represent s.d.
Figure Data
Acknowledgments
This image is the copyrighted work of the attributed author or publisher, and
ZFIN has permission only to display this image to its users.
Additional permissions should be obtained from the applicable author or publisher of the image.
Full text @ Dis. Model. Mech.