
- Title
-
Cell kinetics in the adult neurogenic niche and impact of diet-induced accelerated aging
- Authors
- Stankiewicz, A.J., Mortazavi, F., Kharchenko, P.V., McGowan, E.M., Kharchenko, V., Zhdanova, I.V.
- Source
- Full text @ J. Neurosci.
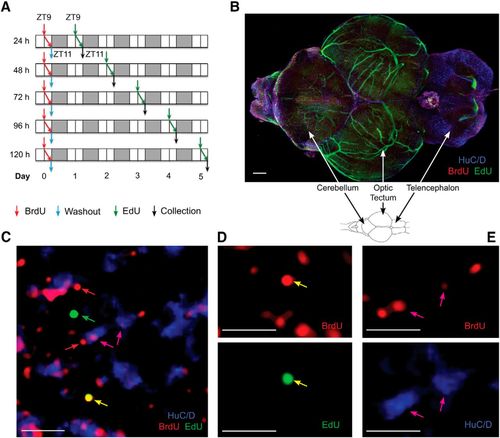
The pulse-chase BrdU-EdU protocol reveals proliferating cells and newly developing neurons in young adult zebrafish brain. A, Experimental protocol involving BrdU pulse and EdU chase 1–5 d thereafter. Arrows indicate BrdU administration (red), BrdU washout (blue), EdU injection (green), and sample collection (black). BrdU and EdU exposure at ZT9–11, with ZT0 = lights-on time; 14:10 light-dark cycle. White area represents light. Gray area represents dark. N = 5 or 6 fish per time point. B, Cleared zebrafish brain following a 15 d pulse-chase. Scale bar, 150 μm. C, Labeled cells within cerebellar neurogenic niche, following 15 d chase. Arrows indicate BrdU/EdU colocalization (yellow), EdU-only (green), BrdU-only (red), and BrdU/HuC/D colocalization (magenta). Scale bar, 10 μm. D, Single-channel images for the colabeled yellow stem cell in C, BrdU (red) and EdU (green) representing NSCs. E, Single-channel images for cells colabeled for BrdU (red) and HuC/D (blue), representing immature neurons. Scale bar, 10 μm. |
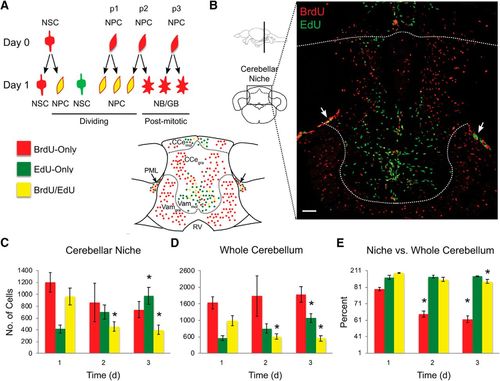
Daily proliferative activity in the brain of normal 1-year-old zebrafish. Cell proliferation in the cerebellum over a 1 to 3 d BrdU/EdU pulse-chase. A, Schematics of representative cell division modes and cell color on the day of BrdU pulse (day 0) and EdU chase (day 1). RV, Rhombencephalic ventricle. B, Representative image of labeled cells in the cerebellar niche and outside parenchyma on day 3 of BrdU/EdU pulse-chase, and corresponding schematics. Arrows indicate posterior mesencephalic layer (PML). Scale bar, 50 μm. C, Number of labeled cells in the cerebellar neurogenic niche. D, Number of labeled cells in the whole cerebellum. E, Percentage of labeled cells in the neurogenic niche versus whole cerebellum. Cell counts conducted in brain sections. Red represents BrdU-only. Green represents EdU-only. Yellow represents BrdU/EdU colocalized. N = 5 or 6 fish per time point. Data are mean ± SEM. *p < 0.05, relative to day 1. |
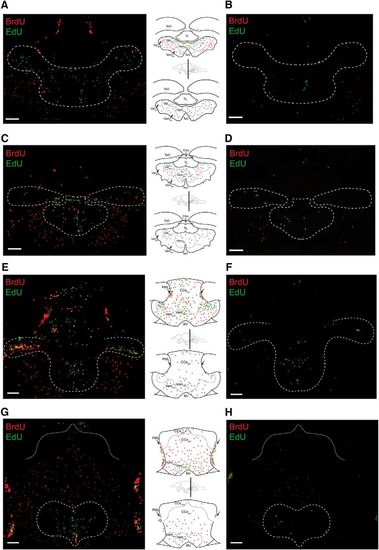
Chronic HCI alters proliferative capacity of zebrafish brain. Representative cerebellar images and corresponding schematics in 1-year-old Control (left column, top) and HCI (right column, bottom) zebrafish on day 3 of BrdU-EdU pulse-chase. A, B, Rostral valvula cerebelli (corresponding to Wulliman et al., 1996, atlas section 179). C, D, Valvula cerebelli (corresponding to Wulliman et al., 1996, atlas section 196). E, F, Caudal valvula cerebelli and rostral corpus cerebelli (corresponding to Wulliman et al., 1996, atlas sections 201–204). G, H, End of valvula cerebelli and mid corpus cerebelli (corresponding to Wulliman et al., 1996, atlas sections 213–219). TeO, Optic tectum; Ctec, commissura tecti; TeV, tectal ventricle; PML, posterior mesencephalic layer; RV, rhombencephalic ventricle; TL, torus longitudinalis. Dashed line indicates neurogenic cerebellar niche regions. Red represents BrdU-only. Green represents EdU-only. Yellow represents BrdU/EdU colocalized. Scale bar, 50 μm. |