
- Title
-
Mutations in the microtubule-associated protein MAP11 (C7orf43) cause microcephaly in humans and zebrafish
- Authors
- Perez, Y., Bar-Yaacov, R., Kadir, R., Wormser, O., Shelef, I., Birk, O.S., Flusser, H., Birnbaum, R.Y.
- Source
- Full text @ Brain
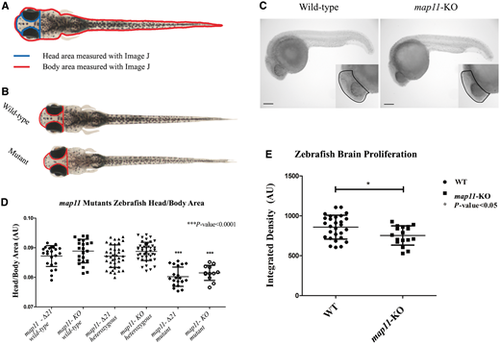
CRISPR/Cas9-mediated MAP11-orthologue zebrafish mutants recapitulate the human microcephaly phenotype. (A) Head to body area measurements of CRISPR/Cas9 MAP11 orthologue mutants. Zebrafish head and body surface area were measured at age 28 days post fertilization using ImageJ software. Head to body area ratios are plotted. (B) Wild-type and homozygous map11-Δ21 mutant zebrafish (28 days post fertilization) demonstrating same body area surface. A red line highlights the head surface area of each larva showing smaller head of map11-Δ21 mutants compared to wild-types. (C) Images of 24 hpf zebrafish embryos stained for phospho-Histone H3. Images of map11-KO embryos show decreased proliferating cells within brain regions compared to wild-types (black dots). Scale bar = 0.5 mm. (D) Head-to-body ratios of map11-KO and map11-Δ21homozygous mutants. P-values represent comparison of each mutant (map11-Δ21 and map11-KO) to its corresponding wild-type control. P-values were calculated using an unpaired two-sided student t-test. (E) A graph showing greater proliferation capacity of wild-type (n = 28) compared to map11- KO (n = 17) zebrafish brains (measured by integrated density of the region of interest). PHENOTYPE:
|
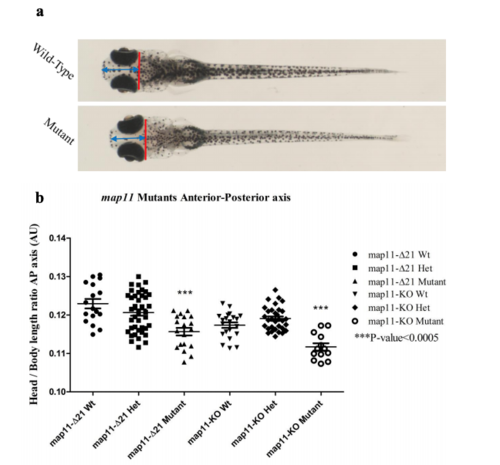
Shortening of the anterior-posterior axis of mutant zebrafish heads. a) A scheme demonstrating the anterior-posterior length measures done for zebrafish. The head length was defined as the length measured between the middle of a virtual line crossing the plan posterior to zebrafish eyes (in red) and the zebrafish most anterior part (blue arrowed line). Zebrafish body length was measured from the edge of the caudal fin to the zebrafish most anterior part (not shown in scheme). All measures were done using image J software. b) A graph showing a significant shortening of the anterior-posterior axis of mutant zebrafish heads. PHENOTYPE:
|
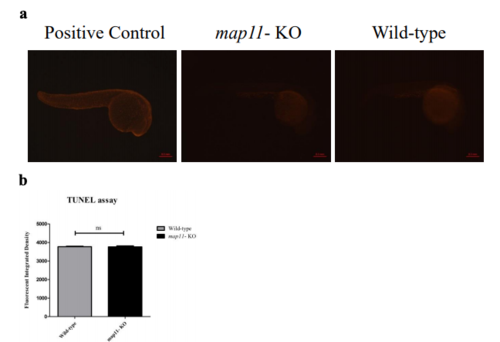
Zebrafish whole- mount TUNEL assay. a) Images of fluorescence microscopy showing 24hpf zebrafish embryos stained via TUNEL assay. Positive controls are wild-type zebrafish embryos incubated with DNAse I prior to TUNEL staining. Apoptotic cells are shown in red color. Scale bar is 0.5mm. b) A graph showing no difference in total apoptosis (measured as fluorescent integrated density) between wild-type and map11-KO zebrafish PHENOTYPE:
|