
- Title
-
Light-activated Frizzled7 reveals a permissive role of non-canonical Wnt signaling in mesendoderm cell migration
- Authors
- Čapek, D., Smutny, M., Tichy, A.M., Morri, M., Janovjak, H., Heisenberg, C.P.
- Source
- Full text @ Elife
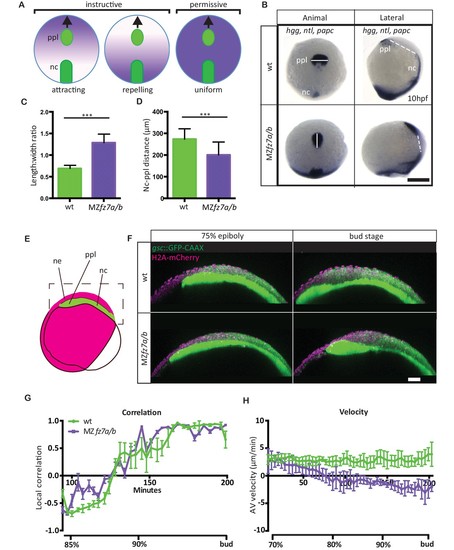
MZfz7a/b prechordal plate phenotype.(A) Possible modes of Wnt-Fz/PCP function in ppl migration. The direction of ppl (green) migration (black arrows) could be influenced by an attracting or repellent gradient of Wnt-Fz/PCP signaling (purple), which polarizes ppl cells, and thus directs their migration instructively. Alternatively, uniform Wnt-Fz/PCP signaling could operate in a permissive mode, allowing ppl cells to undergo directed migration by for example controlling general cell motility. (B) Animal (left column) and lateral (right column) views of the notochord (nc) and prechordal plate (ppl) in wt (upper row) and MZfz7a/b mutant (lower row) embryos at the end of gastrulation (bud stage, 10hpf) labeled by in situ hybridization for hgg (ppl), ntl (nc), and papc (paraxial mesoderm). Scale bar, 250 μm. (C,D) Length-to-width ratio of the ppl (C) and distance between the anterior end of the nc and the posterior end of the ppl (D) in wt (green) and MZfz7a/b mutant (purple) embryos. Error bars are standard deviations; N = 23 (wt), 17 (MZfz7a/b), ***p<0.001 (Student’s t-test). (E) Schematic of embryo orientation used for imaging ppl and overlying neurectoderm (ne) movements in (F). Neurectoderm, magenta; ppl and nc, green; boxed area corresponds to the imaged area in (F). (F) Confocal microscopy images of wt (upper row) and MZfz7a/b mutant (lower row) embryos at mid (left, 75% epiboly) and late (right, bud stage) gastrulation. Nuclei are marked by H2A-mCherry expression, and ppl and nc are marked by gsc:GFP-CAAX expression. Scale bar, 50 μm. (G) Local correlation between leading edge ppl cells and overlying ectodermal cells in wt (green) and MZfz7a/b mutant (purple) embryos. X-axis, time (min, stage); y-axis, order parameter of local correlation; error bars are standard error of mean; N = 3 per genotype. (H) Velocities of ppl leading edge cells in wt (green) and MZfz7a/b mutant (purple) embryos. X-axis, time (min, stage); y-axis, velocity in vegetal to animal pole direction; error bars are standard error of mean; N = 3 per genotype. |
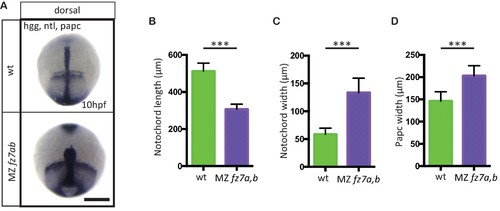
MZfz7a/b convergence and extension phenotypes.(A) Dorsal view of wt(upper panel) and MZfz7a/b mutant (lower panel) embryos at the end of gastrulation (bud stage, 10 hpf) labeled by in situ hybridization for hgg (ppl), ntl (notochord), and papc (paraxial mesoderm). Scale bar, 250 μm. (B–D) Quantitation of the dorsal convergence and extension phenotypes of the notochord (B and C) and the paraxial mesoderm (D), error bars are standard deviations; N = 78 (wt), 63 (MZfz7a/b), ***p<0.001 (Student’s t-test). |
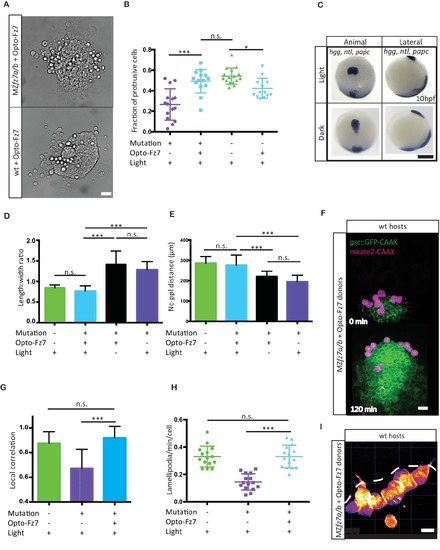
Uniform activation of Opto-Fz7 signaling in MZfz7a/b mutants.(A) Bright-field images of ppl explants from wt and MZfz7a/b mutant embryos both expressing Opto-Fz7 and injected with 9-cis-retinal. Scale bar, 40 μm. (B) Fraction of ppl cells at the edge of the explants shown in (A) displaying lamellipodia-like protrusions after 4 hrs in culture. Opto-Fz7 expressing explants were compared to MZfz7a/b and wt explants shown in Figure 3B. N = 12 explants per genotype, ***p<0.001, *p<0.05, and n.s., non significant (ANOVA followed by Tukey’s multiple comparison test). (C) Animal (left column) and lateral (right column) views of the notochord (nc) and prechordal plate (ppl) in MZfz7a/b mutant embryos expressing Opto-Fz7 and injected with 9-cis-retinal at the end of gastrulation (bud stage, 10hpf) labeled by in situ hybridization for hgg (ppl), ntl (nc), and papc(paraxial mesoderm). Embryos were either exposed to light (upper row) or kept in the dark (lower row). Scale bar, 250 μm. (D,E) Length-to-width ratio of the ppl (D) and distance between the anterior end of the nc and the posterior end of the ppl (E) in MZfz7a/b mutant embryos expressing Opto-Fz7 and injected with 9-cis-retinal either exposed to light (blue) or kept in the dark (black). Wt (green) and untreated MZfz7a/b mutant (purple) embryos were included as controls. Error bars are standard deviations. N = 25 (wt), 24 (MZfz7a/b), 36 (Opto-Fz7, light), 36 (Opto-Fz7, dark), ***p<0.001, and n.s., non significant (Kruskal-Wallis test followed by Dunn’s multiple comparison test). (F) Confocal images of the ppl in wt host embryos containing transplanted MZfz7a/b mutant donor cells (magenta) expressing Opto-Fz7 and mkate2-CAAX and injected with 9-cis-retinal. Dorsal views with animal pole to the top. Host cells are marked by gsc:GFP-CAAX expression (green). Scale bar, 40 μm. (G) Local correlation between host and donor ppl cell movements shown in (F), compared to MZfz7a/b and wt ppl donor cells shown in Figure 2C. Error bars are standard deviations. N = 22 (wt), 36 (mutants), and 35 (mutants expressing Opto-Fz7) binned sectors from 3 embryos each, ***p<0.001, and n.s., non significant (Kruskal-Wallis test followed by Dunn’s multiple comparison test). (H) Number of lamellipodia-like protrusions per cell and minute in the transplanted donor cells shown in (I), compared to MZfz7a/b and wt ppl donor cells shown in Figure 3D. N = 15 cells per genotype, ***p<0.001, and n.s., non significant (ANOVA followed by Tukey’s multiple comparison test). (I) Confocal images of transplanted MZfz7a/b mutant donor ppl cells expressing OptoFz7 and mkate2-CAAX and injected with 9-cis-retinal within the ppl of a wt host embryo (anterior edge outlined by dashed white line). Scale bar, 20 μm.
|
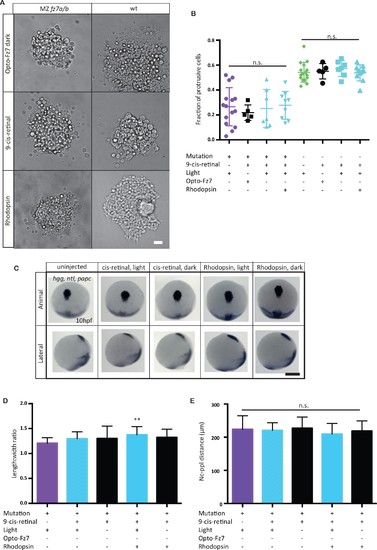
Opto-Fz7 control experiments.(A) Bright-field images of ppl explants from wt and MZfz7a/b mutant embryos either injected with Opto-Fz7 and 9-cis-retinal and kept in dark (red light for imaging, control 1), or injected with Rhodopsin and 9-cis-retinal and exposed to light (control 2), or injected with 9-cis-retinal and kept in light (control 3). Scale bar, 40 μm. (B) Fraction of ppl cells at the edge of the explants shown in (A) displaying lamellipodia-like protrusions after 4 hrs in culture, compared to MZfz7a/b and wt explants without Opto-Fz7 as shown in Figure 3B. N = 5 (Opto-Fz7, dark), 9 (Rhodopsin), 7 (9-cis-retinal), n.s., non significant (Mann-Whitney test). (C) Animal (upper panels) and lateral (lower panels) views of the notochord (nc) and prechordal plate (ppl) in MZfz7a/b mutant embryos injected either with rhodopsin mRNA together with 9-cis-retinal or with 9-cis-retinal only at the end of gastrulation (bud stage, 10 hpf) labeled by in situ hybridization for hgg (ppl), ntl (nc), and papc (paraxial mesoderm). Embryos were either exposed to light or kept in the dark. Scale bar, 250 μm. (D,E) Length-to-width ratio of the ppl (D) and distance between the anterior end of the nc and the posterior end of the ppl (E) in MZfz7a/b mutant embryos injected either with rhodopsin mRNA together with 9-cis-retinal or with 9-cis-retinal only, either exposed to light (sky blue) or kept in the dark (black). Untreated MZfz7a/b mutant (purple) embryos were included as controls. Error bars, standard deviations. N = 15 (MZfz7a/b), 15 (cis-retinal, light), 17 (cis-retinal, dark), 30 (Rhodopsin, light), 31 (Rhodopsin, dark), **p<0.01, and n.s., non significant (ANOVA followed by Tukey’s multiple comparison test).
|
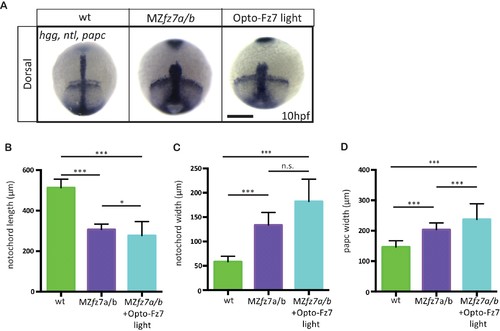
Convergence and extension movements in MZfz7a/b mutants after Opto-Fz7 activation.(A) Dorsal views of wt and MZfz7a/b mutant embryos, as well as MZfz7a/bmutant embryos expressing Opto-Fz7 and injected with 9-cis-retinal at the end of gastrulation (bud stage, 10 hpf) labeled by in situ hybridization for hgg (ppl), ntl (nc), and papc (paraxial mesoderm). Embryos were exposed to light. Scale bar, 250 μm. (B–D) Notochord length (B) and width (C), and width of the paraxial mesoderm (D) in wt MZfz7a/b mutant embryos, as well as MZfz7a/b mutant embryos expressing Opto-Fz7 and injected with 9-cis-retinal, compared to uninjected mutant and wt embryos from Figure 1—figure supplement 1B-D. N = 78 (wt), 63 (MZfz7a/b), 21 (MZfz7a/b plus Opto-Fz7), *p<0.05, ***p<0.001 (ANOVA followed by Tukey’s multiple comparison test for B and D, Kruskal-Wallis test followed by Dunn’s multiple comparison test for C)
|