
- Title
-
Characterization of ADP-ribosyl cyclase 1-like (ARC1-like) activity and NAADP signaling during slow muscle cell development in zebrafish embryos
- Authors
- Kelu, J.J., Webb, S.E., Galione, A., Miller, A.L.
- Source
- Full text @ Dev. Biol.
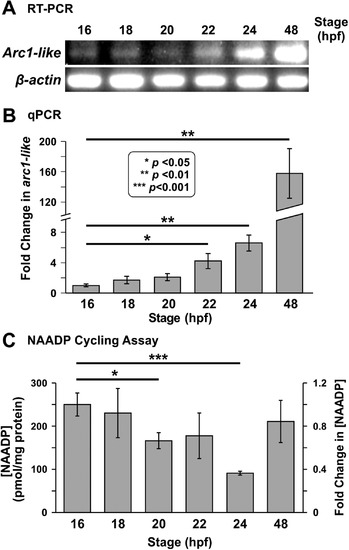
Expression of thearc1-liketranscript and detection of NAADP in whole zebrafish embryos from ~ 16 hpf to ~ 48 hpf. (A) RT-PCR followed by gel electrophoresis was conducted to show the relative expression of arc1-like in zebrafish embryos at ~ 16 hpf, ~ 18 hpf, ~ 20 hpf, ~ 22 hpf, ~ 24 hpf, and ~ 48 hpf (n = 4 for each time point). β-actin was used as an internal control. (B) Bar graph to show the mean ± SEM fold-change in arc1-likeexpression detected by quantitative real-time PCR (qPCR) relative to 16 hpf (n = 6). The expression of arc1-like was normalized to three house-keeping genes, actb2, ef1α, and rpl13a. (C) The NAADP cycling assay was employed to detect the endogenous level of NAADP in whole embryo extracts prepared at ~ 16 hpf, ~ 18 hpf, ~ 20 hpf, ~ 22 hpf, ~ 24 hpf, and ~ 48 hpf. This bar graph shows the normalized [NAADP] detected in the extract samples, and the corresponding fold-change in [NAADP] (n = 9). In (B) and (C), the asterisks indicate statistically significant differences at p < 0.05 (*), p < 0.01 (**) and p < 0.001 (***). In (C), the data obtained at ~ 18 hpf to ~ 48 hpf were compared statistically, with those obtained at ~ 16 hpf. EXPRESSION / LABELING:
|
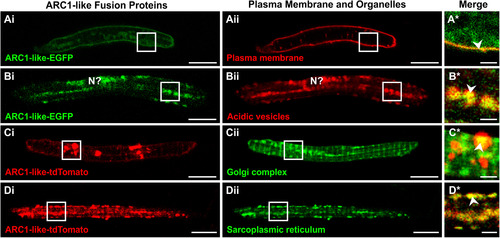
Localization of ARC1-like fusion proteins in zebrafish primary cultured muscle cells. (A–D) Approximately 100–200 ng of either arc1-like-EGFP mRNAor arc1-like-tdTomato mRNA was injected into the blastodisc of zebrafish embryos at the one-cell stage to transiently overexpress the ARC1-like fusion proteins. At ~ 48 hpf, the embryos were digested and primary cultures were prepared from the dissociated cells. Primary cultured muscle cells that expressed (Ai, Bi) ARC1-like-EGFP were then labelled with (Aii) FM 6–46 (n = 24) or (Bii)LysoTracker Red DND-99 (n = 44) to visualize the plasma membrane or acidic vesicles, respectively, whereas those expressing (Ci, Di) ARC1-like-tdTomato were labelled with (Cii) BODIPY FL C5-ceramide (n = 16) or (Dii) ER-Tracker Green (n = 14) to visualize the Golgi complex or sarcoplasmic reticulum (SR), respectively. These are single optical sections to show the distribution of (Ai, Bi) ARC1-like-EGFP expression (in green) with respect to (Aii) the plasma membrane or (Bii) acidic vesicles (both in red), or the distribution of (Ci, Di) ARC1-like-tdTomato expression (in red) with respect to (Cii) the Golgi complex or (Dii) the sarcoplasmic reticulum (both in green). The regions bounded by the white squares in panels (Ai–Aii, Bi–Bii, Ci–Cii, Di–Dii)are shown at higher magnification and when the green and red channels are merged in the panels (A*–D*), respectively. In the merged images in panels (A*–D*), overlapping regions are shown in yellow. The arrowheads in panels (A*–D*)indicate overlap in fluorescence (yellow) between the ARC1-like fusion proteins and the various cellular compartments. “N?” in panel (Bi, Bii) is the putative location of the nucleus. Scale bars, 10 µm (in panels Ai–Aii, Bi–Bii, Ci–Cii, Di–Dii); and 2 µm (in panels A*–D*). |
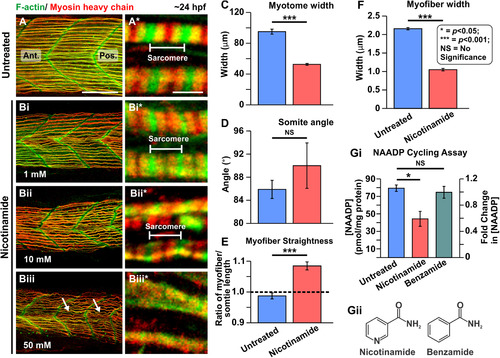
Effect of nicotinamide on the organization of the trunk musculature and the formation of the sarcomeres. At ~ 17 hpf, embryos had the terminal portion of the tail excised and then they were treated with (A) Danieau's solution alone or Danieau's solution containing nicotinamide at: (Bi) 1 mM, (Bii) 10 mM, or (Biii) 50 mM. All the embryos were fixed at ~ 24 hpf and dual-labelled with phalloidin and the F59 antibody, to visualize F-actin (in green) and myosin heavy chain (in red) in the trunk musculature, respectively. The panels show series of optical sections projected as single images at (A, Bi–Biii) low and (A*, Bi*–Biii*) higher magnification when the green and red channels are merged; overlapping regions are shown in yellow. The higher magnification images of the slow myofibers reveal the presence or absence of the sarcomeric banding pattern. The white arrows in panel (Biii) show the disorganized nature of some slow myofibers. Ant. and Pos. are anterior and posterior, respectively. Scale bars, 50 µm (in panels A, Bi–Biii), and 2 µm (in panels A*, Bi*–Biii*). (C–F) In order to determine the level of disruption on slow muscle cell development following nicotinamide treatment, various dimensions of the trunk musculature and slow myofibers were measured. These bar graphs show the mean ± SEM: (C) myotome width (all n = 15, from 5 embryos), (D) somite angle (n = 15, from 5 embryos), (E)myofiber length:somite length ratio (n = 60 from 5 embryos); and (F) myofiber width (n = 50, from 5 embryos). The black dashed line in panel (E) indicates a myofiber:somite length ratio of 1. (Gi) The NAADP cycling assay was employed to detect the endogenous level of NAADP in whole embryo extracts that were either untreated, or treated with nicotinamide or benzamide. This bar graph shows the normalized [NAADP] detected in sample extracts and the corresponding fold-change in [NAADP] (n = 3). (Gii) Chemical structure of nicotinamide and benzamide. In panels (C–G), the asterisks indicate statistically significant differences at p < 0.05 (*) and p < 0.001 (***), whereas NS indicates that no significant difference was observed. |
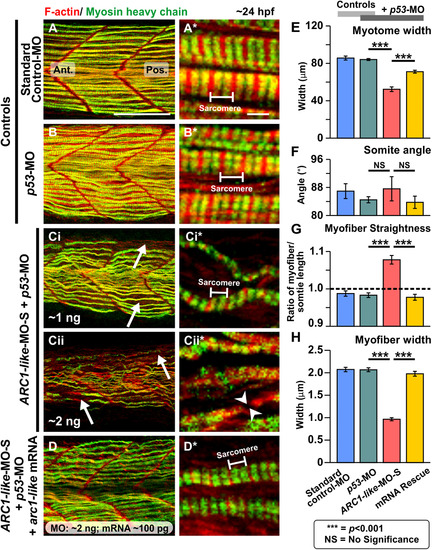
Effect of MO-based knockdown of ARC1-like (without and with mRNA rescue) on the organization of the trunk musculature and the formation of the sarcomeres. Embryos were injected with (A) ~ 5 ng standard control-MO; (B) ~ 5 ng p53-MO; (Ci) ~ 1 ng ARC1-like-MO-S + ~ 1 ng p53-MO; (Cii) ~ 2 ng ARC1-like-MO-S + ~ 2 ng p53-MO; or (D) ~ 2 ng ARC1-like-MO-S + ~ 2 ng p53-MO + ~ 100 ng arc1-like mRNA. All the embryos were fixed at ~ 24 hpf and dual-labelled with phalloidin and the F59 antibody, to visualize F-actin (in red) and myosin heavy chain (in green) in the trunk musculature, respectively. The panels show a series of optical sections projected as single images at (A, B, Ci, Cii, D) low and (A*, B*, Ci*, Cii*, D*)higher magnification when the red and green channels are merged; overlapping regions are shown in yellow. The higher magnification images of the slow myofibers reveal the presence or absence of the sarcomeric banding pattern of the F-actin and myosin heavy chain. The white arrows in panels (Ci, Cii) show the disorganization of some of the slow myofibers, whereas the white arrowheads in panel (Cii*) indicate a gap in one of the myofibers. Ant. and Pos. are anterior and posterior, respectively. Scale bars, 50 µm (in panels A, B, Ci, Cii, D), and 2 µm (in panels A*, B*, Ci*, Cii*, D*). (E–H) In order to determine the level of disruption on slow muscle cell development following ARC1-like-knockdown, various dimensions of the trunk musculature and slow myofibers were measured. These bar graphs show the mean ± SEM: (E) myotome width (all n = 18, from 6 embryos), (F)somite angle (n = 18, from 6 embryos), (G) myofiber length:somite length ratio (n = 162 from 6 embryos); and (H)myofiber width (n = 60, from 6 embryos). The black dashed line in panel (G) indicates a myofiber:somite length ratio of 1. The asterisks indicate statistically significant differences at p < 0.001 (***), whereas NS indicates that no significant difference was observed. |

ZFIN is incorporating published figure images and captions as part of an ongoing project. Figures from some publications have not yet been curated, or are not available for display because of copyright restrictions. EXPRESSION / LABELING:
PHENOTYPE:
|
Reprinted from Developmental Biology, 445(2), Kelu, J.J., Webb, S.E., Galione, A., Miller, A.L., Characterization of ADP-ribosyl cyclase 1-like (ARC1-like) activity and NAADP signaling during slow muscle cell development in zebrafish embryos, 211-225, Copyright (2018) with permission from Elsevier. Full text @ Dev. Biol.