
- Title
-
Inducible Intestine-Specific Expression of krasV12 Triggers Intestinal Tumorigenesis In Transgenic Zebrafish.
- Authors
- Lu, J.W., Raghuram, D., Fong, P.A., Gong, Z.
- Source
- Full text @ Neoplasia
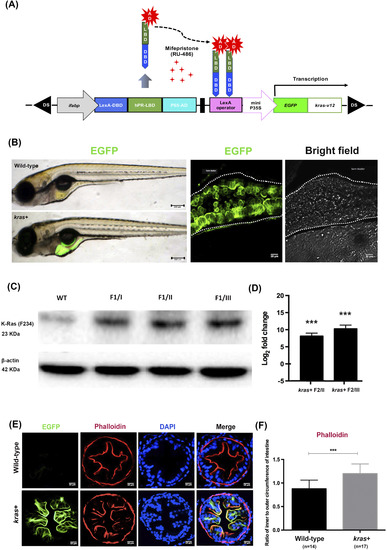
Generation and characterization of Tg(ifabp:EGFP-krasV12) transgenic zebrafish. (A) Schematic diagram showing the DNA pDs-ifabp:LexPR-Lexop:EGFP-krasV12 construct used for the generation of Tg(ifabp:EGFP-krasV12) transgenic fish. Ds, maize Ds transposon sequence. (B) Intestine-specific expression of EGFP-krasV12 in F1 transgenic fry and wild-type fish, and confocal image of whole mounted kras+ transgenic larva at 8 dpf following induction by 1 μM Mifepristone. The images were obtained at z = 5 μm over a thickness of 50 μm. (C) Western blot analysis of total proteins from WT and kras+ transgenic fish in the gut tissue from three founder lineage (I, II, and III) for the detection of the Kras protein. β-Actin, internal control for equal loading. (D) RT-qPCR analysis of kras RNA expression in the kras+ transgenic F2 whole larvae from founders I and III. N = 20 larvae from each founder (at 2 dpi using 1 μM mifepristone) were used for isolation of proteins and mRNA. (E) Fluorescence micrographs of intestine cross sections from wild-type and kras+ zebrafish larvae showing green fluorescence or phalloidin staining. (F) Quantification of villi by ratio of inner to outer circumferences of intestine at 10 dpi by 2 μM mifepristone. Statistical significance: ***P < .001. EXPRESSION / LABELING:
PHENOTYPE:
|

ZFIN is incorporating published figure images and captions as part of an ongoing project. Figures from some publications have not yet been curated, or are not available for display because of copyright restrictions. EXPRESSION / LABELING:
PHENOTYPE:
|
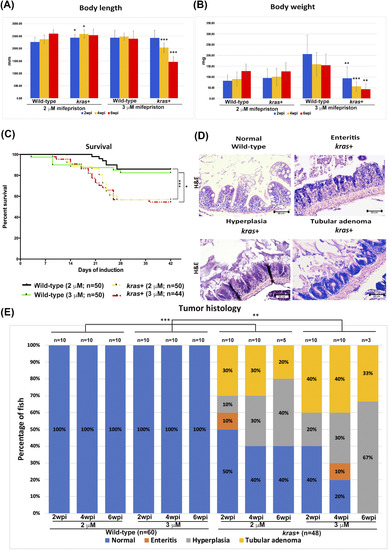
Phenotypic characterization of intestinal tumorigeneis in kras+ transgenic zebrafish. Wild-type and kras+ fish were treated with 2 or 3 μM mifepristone from 2 mpf, and samples were collected at 2, 4, and 6 wpi for gross observations and histological analyses. (A) Body length. (B) Body weight. (C) Survival curves. (D) Examples of normal, enteritis, hyperplasia, and tubular adenoma from H&E staining sections of intestine. Wild-type or kras+ fish sources of the sections are indicated. (E) Summary of intestinal histological abnormalities observed in wild-type and kras+ transgenic fish. The data were generated as a result of a blinded histological analysis. Numbers of fish in each group are indicated at the top of each bar. The differences among the variables were assessed using Student's t tests or one-way ANOVA. Statistical significance: *P < .05, **P < .01, ***P < .001. PHENOTYPE:
|
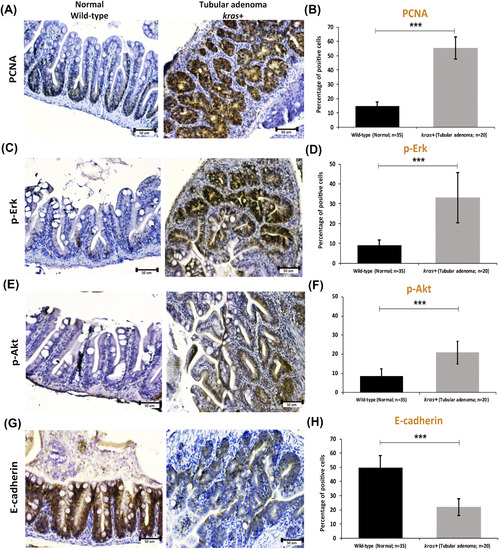
Immunocytochemical staining of PCNA, p-ErK, p-Akt, and E-cadherin in sections of normal intestine from wild-type fish and tubular adenoma from kras+ transgenic zebrafish. (A and B) Immunostaining of PCNA (A) and quantification of percentages of positive cells (B). (C and D) Immunostaining of p-Erk (C) and quantification of percentages of positive cells (D). (E and F) Immunostaining of p-Art (E) and quantification of percentages of positive cells (F). (G and H) Immunostaining of E-cadherin (G) and quantification of percentages of positive cells (H). Numbers of samples from each group are indicated in the quantification histograms. Statistical significance: ***P < .001. EXPRESSION / LABELING:
PHENOTYPE:
|
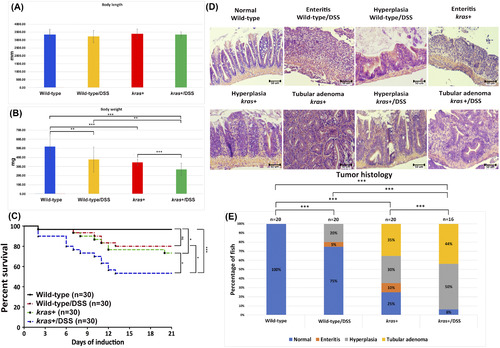
Synergistic effect of krasV12 expression and DSS on intestinal tumorigenesis. Four-mpf wild-type and kras+ fish were co-treated with 2 μM mifepristone and 0.0625% DSS for 3 weeks, and samples were collected for gross observations and histological analyses. There were four groups in the experiment: wild type, wild type/DSS, kras+, and kras+/DSS. (A) Body length. (B) Body weight. (C) Survival curves. (D) Examples of normal, enteritis, hyperplasia, and tubular adenoma from H&E staining sections of intestine. Sources of the sections are indicated. (E) Summary of intestinal histological abnormalities observed in the four experimental groups. The data were generated as a result of a blinded histological analysis (wild type, n = 20; wild type/DSS, n = 20; kras+, n = 20; kras+ with DSS, n = 16). The differences among the variables were assessed using Student's t tests or one-way ANOVA. Statistical significance: *P < .05, **P < .01, and ***P < .001. PHENOTYPE:
|
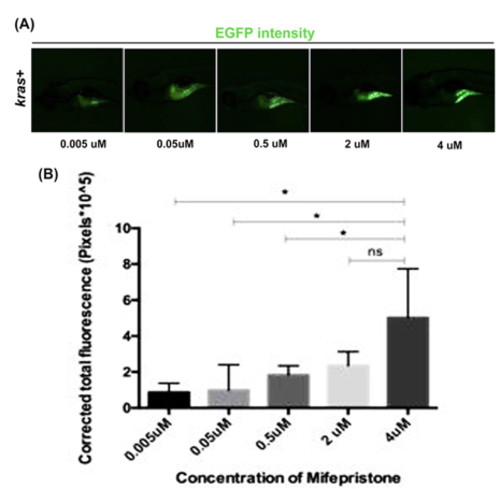
Dosage-dependent induction of EGFP expression in kras+ transgenic larvae. F2 kras+ transgenic larvae were treated using 0.005, 0.05, 0.5, 2, or 4 μM of mifepristone from 3 dpf to 8 dpf. (A) EGFP expression in the intestine was recorded using a digital camera attached to a microscope. All of the photos were obtained at the same magnification and exposure. (B) Quantification of EGFP fluorescence. n=20/group. Statistical significance: *p<0.05. |