
- Title
-
Quantification of glioblastoma progression in zebrafish xenografts: Adhesion to laminin alpha 5 promotes glioblastoma microtumor formation and inhibits cell invasion
- Authors
- Gamble, J.T., Reed-Harris, Y., Barton, C.L., La Du, J., Tanguay, R., Greenwood, J.A.
- Source
- Full text @ Biochem. Biophys. Res. Commun.
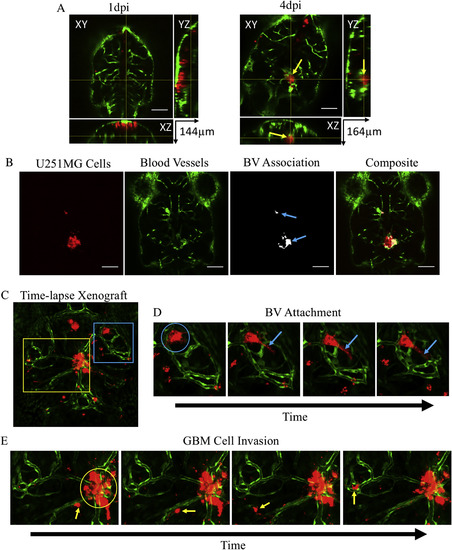
Zebrafish Brain Xenograft. A) Orthogonal views for Z-section of zebrafish brain with U251MG cells (red) and blood vessels (green) at 1 (left) and 4 (right) day post injection displaying microtumor formation (yellow arrow) occurring deep in brain surrounded with blood vessels. B) Representative panels of calculating U251MG cells associations with blood vessels (BV); 100 μm scale bar. C) Maximum projection image frame of 3D time-lapse image of zebrafish brain with blood vessels (green) and transplanted U251MG cells (red) with areas of interest indicated. Blue box: BV attachment. Yellow box: GBM cell invasion. D) Representative time-lapse images of U251MG cell attaching to blood vessels (blue circle) and constricting with pseudopodium (blue arrows). E) Representative time-lapse images of U251MG cell invading zebrafish brain (yellow arrows) and non-invasive U251MG cells (yellow circle). (For interpretation of the references to color in this figure legend, the reader is referred to the Web version of this article.) |
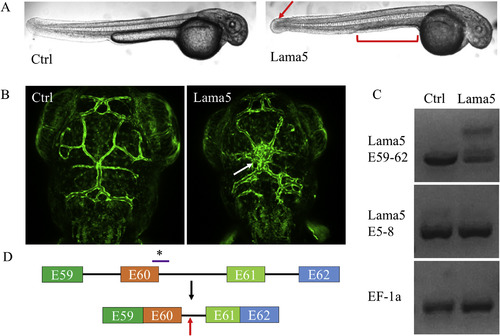
Lama5 morpholino causes creates cryptic intronic splice resulting in m538 phenotype. A) Zebrafish embryos at 2 days post fertilization (dpf) after control (left) or lama5 (right) MO injection. Red arrow indicates reduced tail fin growth. Red bracket indicates loss in yolk sac extension. B) Maximum projection images of blood vessels in the brain of zebrafish larvae at 2 days after control or lama5 MO injection. White arrow indicates disorganized dorsal midline junction of cranial blood vessels. C) Agarose gel of cDNA made from mRNA extraction of pooled zebrafish embryos (20) 2dpf after control or lama5 morpholino (MO) injection. Lama5 E59-62 comprises laminin alpha 5 exons 59 to 62 while lama5 E5-8 comprises exons 5 to 8. D) Lama5 MO causes cryptic intronic splice of lama5 mRNA that includes a fragment of intron 60–61. *Location of MO binding. Red arrow indicates introduction of premature stop codon. (For interpretation of the references to color in this figure legend, the reader is referred to the Web version of this article.) |
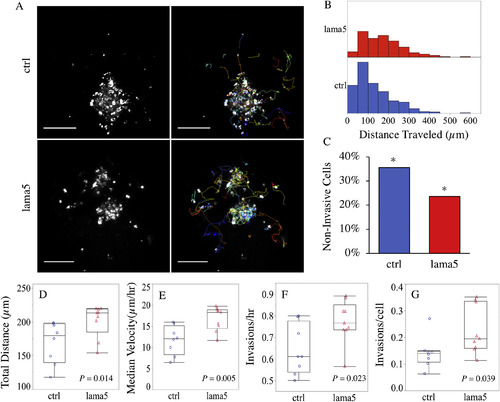
Laminin alpha 5 inhibits invasion in a brain microenvironment. A) Representative maximum projection images of 4D U251MG cell tracking in zebrafish larvae brain. Left to right: CM-DiI-labeled U251MG cells and Trackmate calculated tracks where each color represents the 4D coordinate data of individual cells; 100 μm scale bar. B) Histogram of distance traveled for all U251MG cells (lama5 n = 331, control n = 500). C) Percentage of non-invasive U251MG cells for control and lama5 KD larvae. *Fisher's Exact Test, P < 0.001. D-G) Average total distance (D), average median invasion rate (E), average number of times invasion was initiated per hour (F), average number of times invasion was initiated per cell (G), for lama5 (n = 9) and control (n = 8) zebrafish where each point represents the average U251MG cell statistic per larva. P-values determined by Student's T Test. (For interpretation of the references to color in this figure legend, the reader is referred to the Web version of this article.) |