
- Title
-
Mesenchymal stromal cells prevent progression of liver fibrosis in a novel zebrafish embryo model
- Authors
- van der Helm, D., Groenewoud, A., de Jonge-Muller, E.S.M., Barnhoorn, M.C., Schoonderwoerd, M.J.A., Coenraad, M.J., Hawinkels, L.J.A.C., Snaar-Jagalska, B.E., van Hoek, B., Verspaget, H.W.
- Source
- Full text @ Sci. Rep.
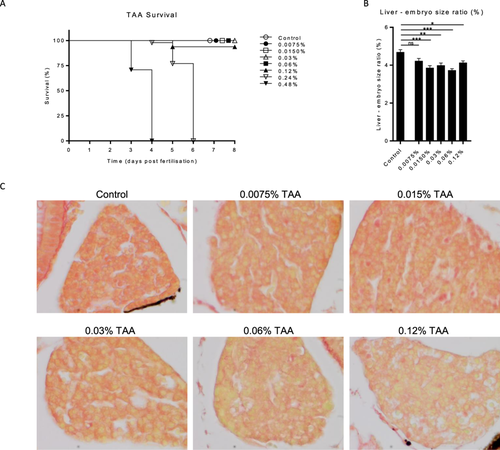
Thioacetamide titration in zebrafish embryos. Zebrafish embryos (2dpf) were treated until 8dpf with different concentrations of TAA in egg water. (A) Survival of the embryos during TAA treatment (N = 50 embryos). (B) At 8dpf the embryos were imaged to measure the sizes of the liver and total embryo in order to calculate the liver to embryo size ratio (N = 2, ±SEM). (C) Sirius-red stained section of TAA treated zebrafish embryo livers (8dpf, 400x magnification). *p ≤ **p ≤ 0.01, ***p ≤ 0.001. PHENOTYPE:
|

ZFIN is incorporating published figure images and captions as part of an ongoing project. Figures from some publications have not yet been curated, or are not available for display because of copyright restrictions. |
|
ZFIN is incorporating published figure images and captions as part of an ongoing project. Figures from some publications have not yet been curated, or are not available for display because of copyright restrictions. |
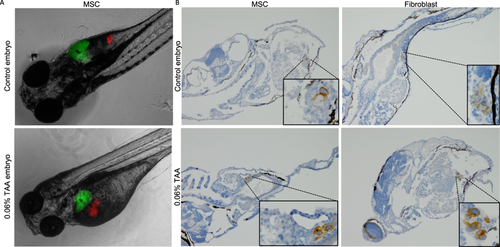
MSC and fibroblast tracing at 8dpf. During fibrotic induction (5dpf) with 0.06% TAA fibroblasts and MSCs were injected in close proximity to the liver. (A) Representative fluorescence images of zebrafish after MSC administration (8dpf) liver (green) and MSCs (red) (20x magnification). (B) Representative Vimentin stained section of fibroblast or MSC treated embryos (20x magnification). |
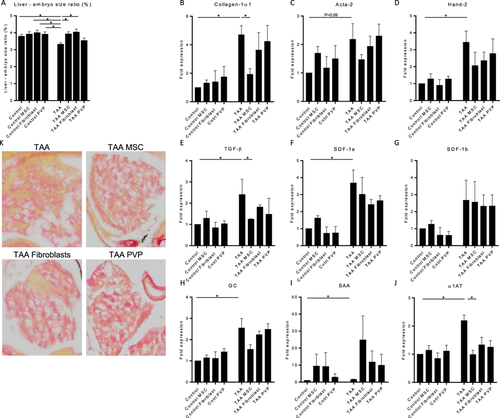
MSCs prevent the progression of liver fibrosis in zebrafish embryos. Quantitative PCR for mRNA expression of fibrotic, tissue damage and liver function genes after TAA treatment and MSC, Fibroblast or PVP injections. (A) At 8dpf the embryos were imaged to measure the sizes of the liver and total embryo in order to calculate the liver to embryo size ratio (N = 2, ±SEM). (B–J) Expression levels of Collagen1α1, Acta-2, Hand-2, TGF-β, SDF-1a, SDF1-b, GC, SAA and α1AT are normalized to RPP and to heathy control embryos. The graphs represent values of three independent experiments (n = 3, ±SEM). *p ≤ 0.05. |