
Image
|
Figure Caption
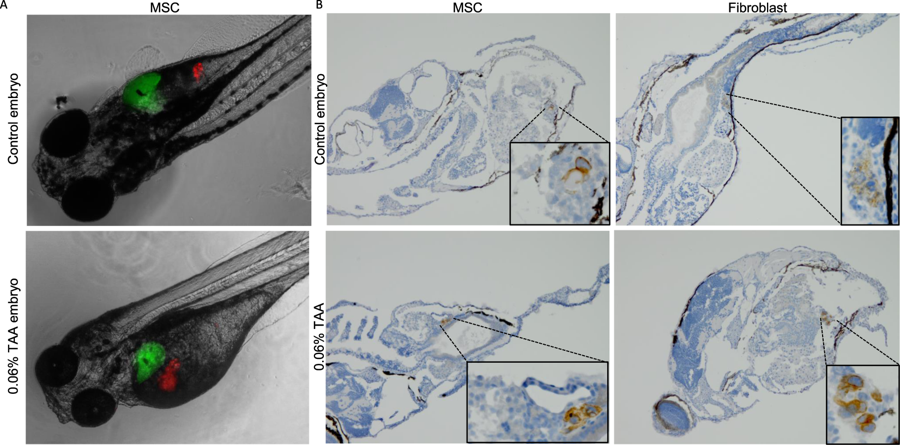
Fig. 5
MSC and fibroblast tracing at 8dpf. During fibrotic induction (5dpf) with 0.06% TAA fibroblasts and MSCs were injected in close proximity to the liver. (A) Representative fluorescence images of zebrafish after MSC administration (8dpf) liver (green) and MSCs (red) (20x magnification). (B) Representative Vimentin stained section of fibroblast or MSC treated embryos (20x magnification).
Acknowledgments
This image is the copyrighted work of the attributed author or publisher, and
ZFIN has permission only to display this image to its users.
Additional permissions should be obtained from the applicable author or publisher of the image.
Full text @ Sci. Rep.