
- Title
-
Grk1b and Grk7a Both Contribute to the Recovery of the Isolated Cone Photoresponse in Larval Zebrafish
- Authors
- Chrispell, J.D., Dong, E., Osawa, S., Liu, J., Cameron, D.J., Weiss, E.R.
- Source
- Full text @ Invest. Ophthalmol. Vis. Sci.

Relative protein expression of Grk homologs in zebrafish cones using a novel zebrafish-specific anti-Grk7 antibody. (A) Immunodetection of 25 μg each of recombinant FLAG-tagged Grk7a and Grk7b prepared from HEK293 cells as described in “Methods.” For immunodetection, the immunoblot was incubated with anti-Grk7 (red) and anti-FLAG (green) antibodies at dilutions of 1:10,000 followed by incubation with secondary antibodies at a dilution of 1:15,000. (B) Immunodetection of endogenous Grk proteins in isolated retinal homogenates of adult zebrafish and heads of 5 dpf larvae. 40 μg of protein was loaded in each lane and the immunoblot was probed using a 1:10,000 dilution of the anti-Grk7 (red) and anti-Grk1 (green) antibodies followed by incubation with a 1:15,000 dilution of the secondary antibodies. (C) Ratio of Grk7 to Grk1 protein expression during zebrafish development. Samples were prepared, immunoblotting performed and quantification performed using Flag-tagged Grk1 and Grk7 as described in “Methods.” |

Detection of Grk1b and Grk7a in knockout larvae. (A) Immunoblot analysis of tissue homogenates isolated from heads of light-adapted wildtype, grk7a−/−, and grk1b−/− larvae at 5 dpf. 40 μg of each sample were loaded per lane. Immunoblots were probed with antibodies against Grk7 (red) and Grk1 (green) followed by incubation with secondary antibodies as described in “Methods.” (B) Relative expression of total Grk1 and Grk7 in knockout lines compared to wildtype larvae at 5 dpf was quantified from the data in (A). All samples were normalized to β-actin immunoreactivity. Bars represent the range of duplicate samples. N.D., none detected. (C) Immunocytochemical analysis of knockout larvae at 5 dpf. Light-adapted larvae were fixed, cryoembedded, and sectioned as described in “Methods.” Sections were probed with anti-Grk7 (red) and anti-Grk1 (green) at a dilution of 1:1000, followed by incubation in secondary antibodies conjugated to AlexaFluor488 and AlexaFluor594, respectively at a dilution of 1:1500.
|
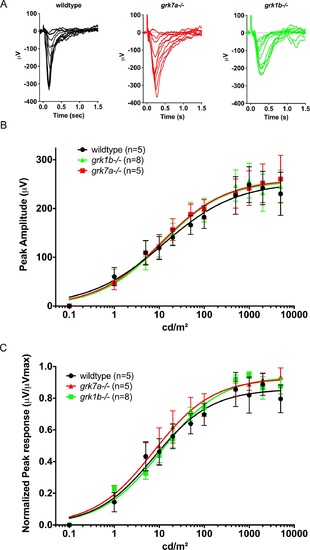
Electrophysiological light responses and normalized sensitivity of grk1b and grk7a knockout larvae. (A) Representative ERG traces of isolated cone-mass receptor potentials in APB-treated larvae at 5 dpf. Reponses were recorded under dark-adapted conditions to 20-ms flashes of light of increasing intensities equal to 0.1, 1, 10, 25, 50, 125, 250, 500, 1250, 2500, and 5000 cd/m2. The fast initial positive deflection can be attributed to a photovoltaic effect with the recording microelectrode. (B) Peak amplitude responses of 5 dpf larvae fit using the Naka-Rushton function. (C) Mean-normalized peak response amplitudes of 5 dpf larvae fit using the Naka-Rushton function. Error bars represent SEM. PHENOTYPE:
|
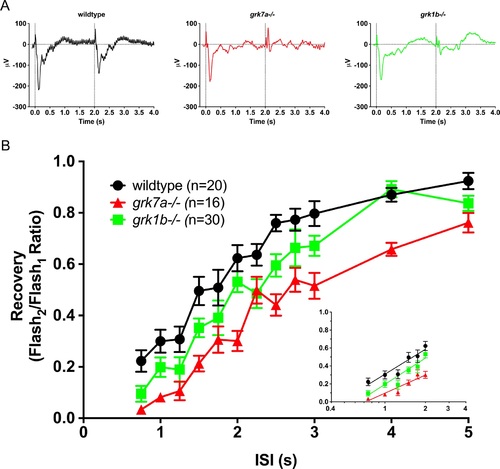
Recovery of the isolated cone-mass receptor potential to successive stimuli. (A) Representative ERG waveforms of APB-treated, dark-adapted larvae subjected to successive stimuli using a dual flash paradigm of a 20-ms flash of saturating white light (1000 cd/m2) with an interstimulus interval (ISI) of 2 s. Vertical black dotted lines indicate time of stimulus. (B) Data are plotted as the ratio of the maximum isolated cone mass receptor potential response of the second stimulus to that of the initial stimulus for ISIs ranging from 0.75 s to 5 s. A linear mixed model analysis of covariance found a significant effect of genotype when compared to wildtype for grk1b−/− (F[1,49] = 6.5; P = 0.0142) and grk7a−/− (F[1,33] = 36.6; P < 0.001). Inset, regression to the logarithmic linear part of the recovery kinetics.[ref. 7] Error bars represent SEM. PHENOTYPE:
|
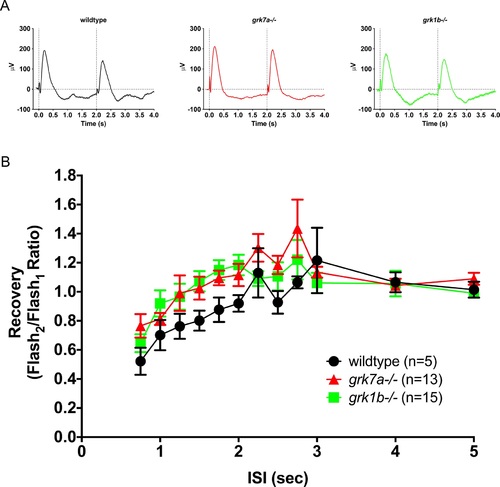
Recovery of the native ERG b-wave to successive stimuli in grk knockout zebrafish larvae. (A) Representative ERG waveforms of untreated, dark-adapted larvae subjected to successive stimuli using a dual flash paradigm of a 20-ms flash of saturating white light (1000 cd/m2) with an interstimulus interval (ISI) of 2 s. Vertical black dotted lines indicate the time of stimulus. (B) Data are plotted as the ratio of the maximum b-wave response amplitude of the second stimulus to that of the initial stimulus for ISIs ranging from 0.75 s to 5 s. A linear mixed model analysis of covariance found no significant effect of genotype when compared to wildtype for grk1b−/− (F[1,14] = 1.2; P = 0.2879) or grk7a−/− larvae (F[1,17] = 3.3; P = 0.0889). Error bars represent SEM. PHENOTYPE:
|

Temporal contrast sensitivity and visual acuity of grk1b and grk7a knockout larvae. Optokinetic response measurements of larval knockout zebrafish at 6 dpf. (A) Optokinetic gain as function of temporal frequency of a sinewave grating. A linear mixed model analysis of covariance found a significant effect of genotype when compared to wildtype for grk1−/− (F[1,209] = 32.9; P < 0.001) and grk7a−/− (F[1,193] = 21.4; P < 0.001) larvae. The accompanying table shows all means and standard errors from the graph. (B) Visual acuity measured in cycles/degree (cpd). P-values were obtained using the Bonferonni post hoc test following 1-way ANOVA. Error bars represent SEM. PHENOTYPE:
|
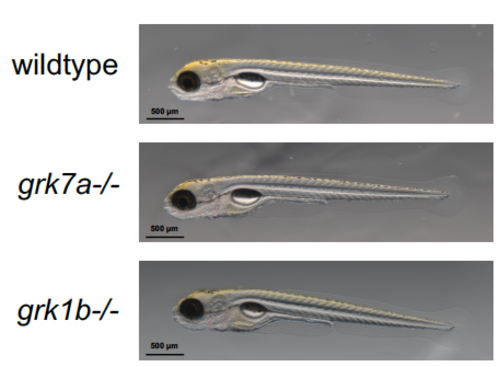
Morphology of whole zebrafish larvae at 5 dpf is qualitatively unchanged in both grk1b-/- and grk7a-/- larvae compared to wildtype. Larvae were anesthetized with 0.02% Tricaine and immobilized in 3% methylcellulose. Brightfield images of larvae were captured with a Zeiss Axio Zoom.V16 stereo zoom microscope with accompanying camera and software (Zeiss, Oberkochen, Germany). PHENOTYPE:
|