
Image
|
Figure Caption
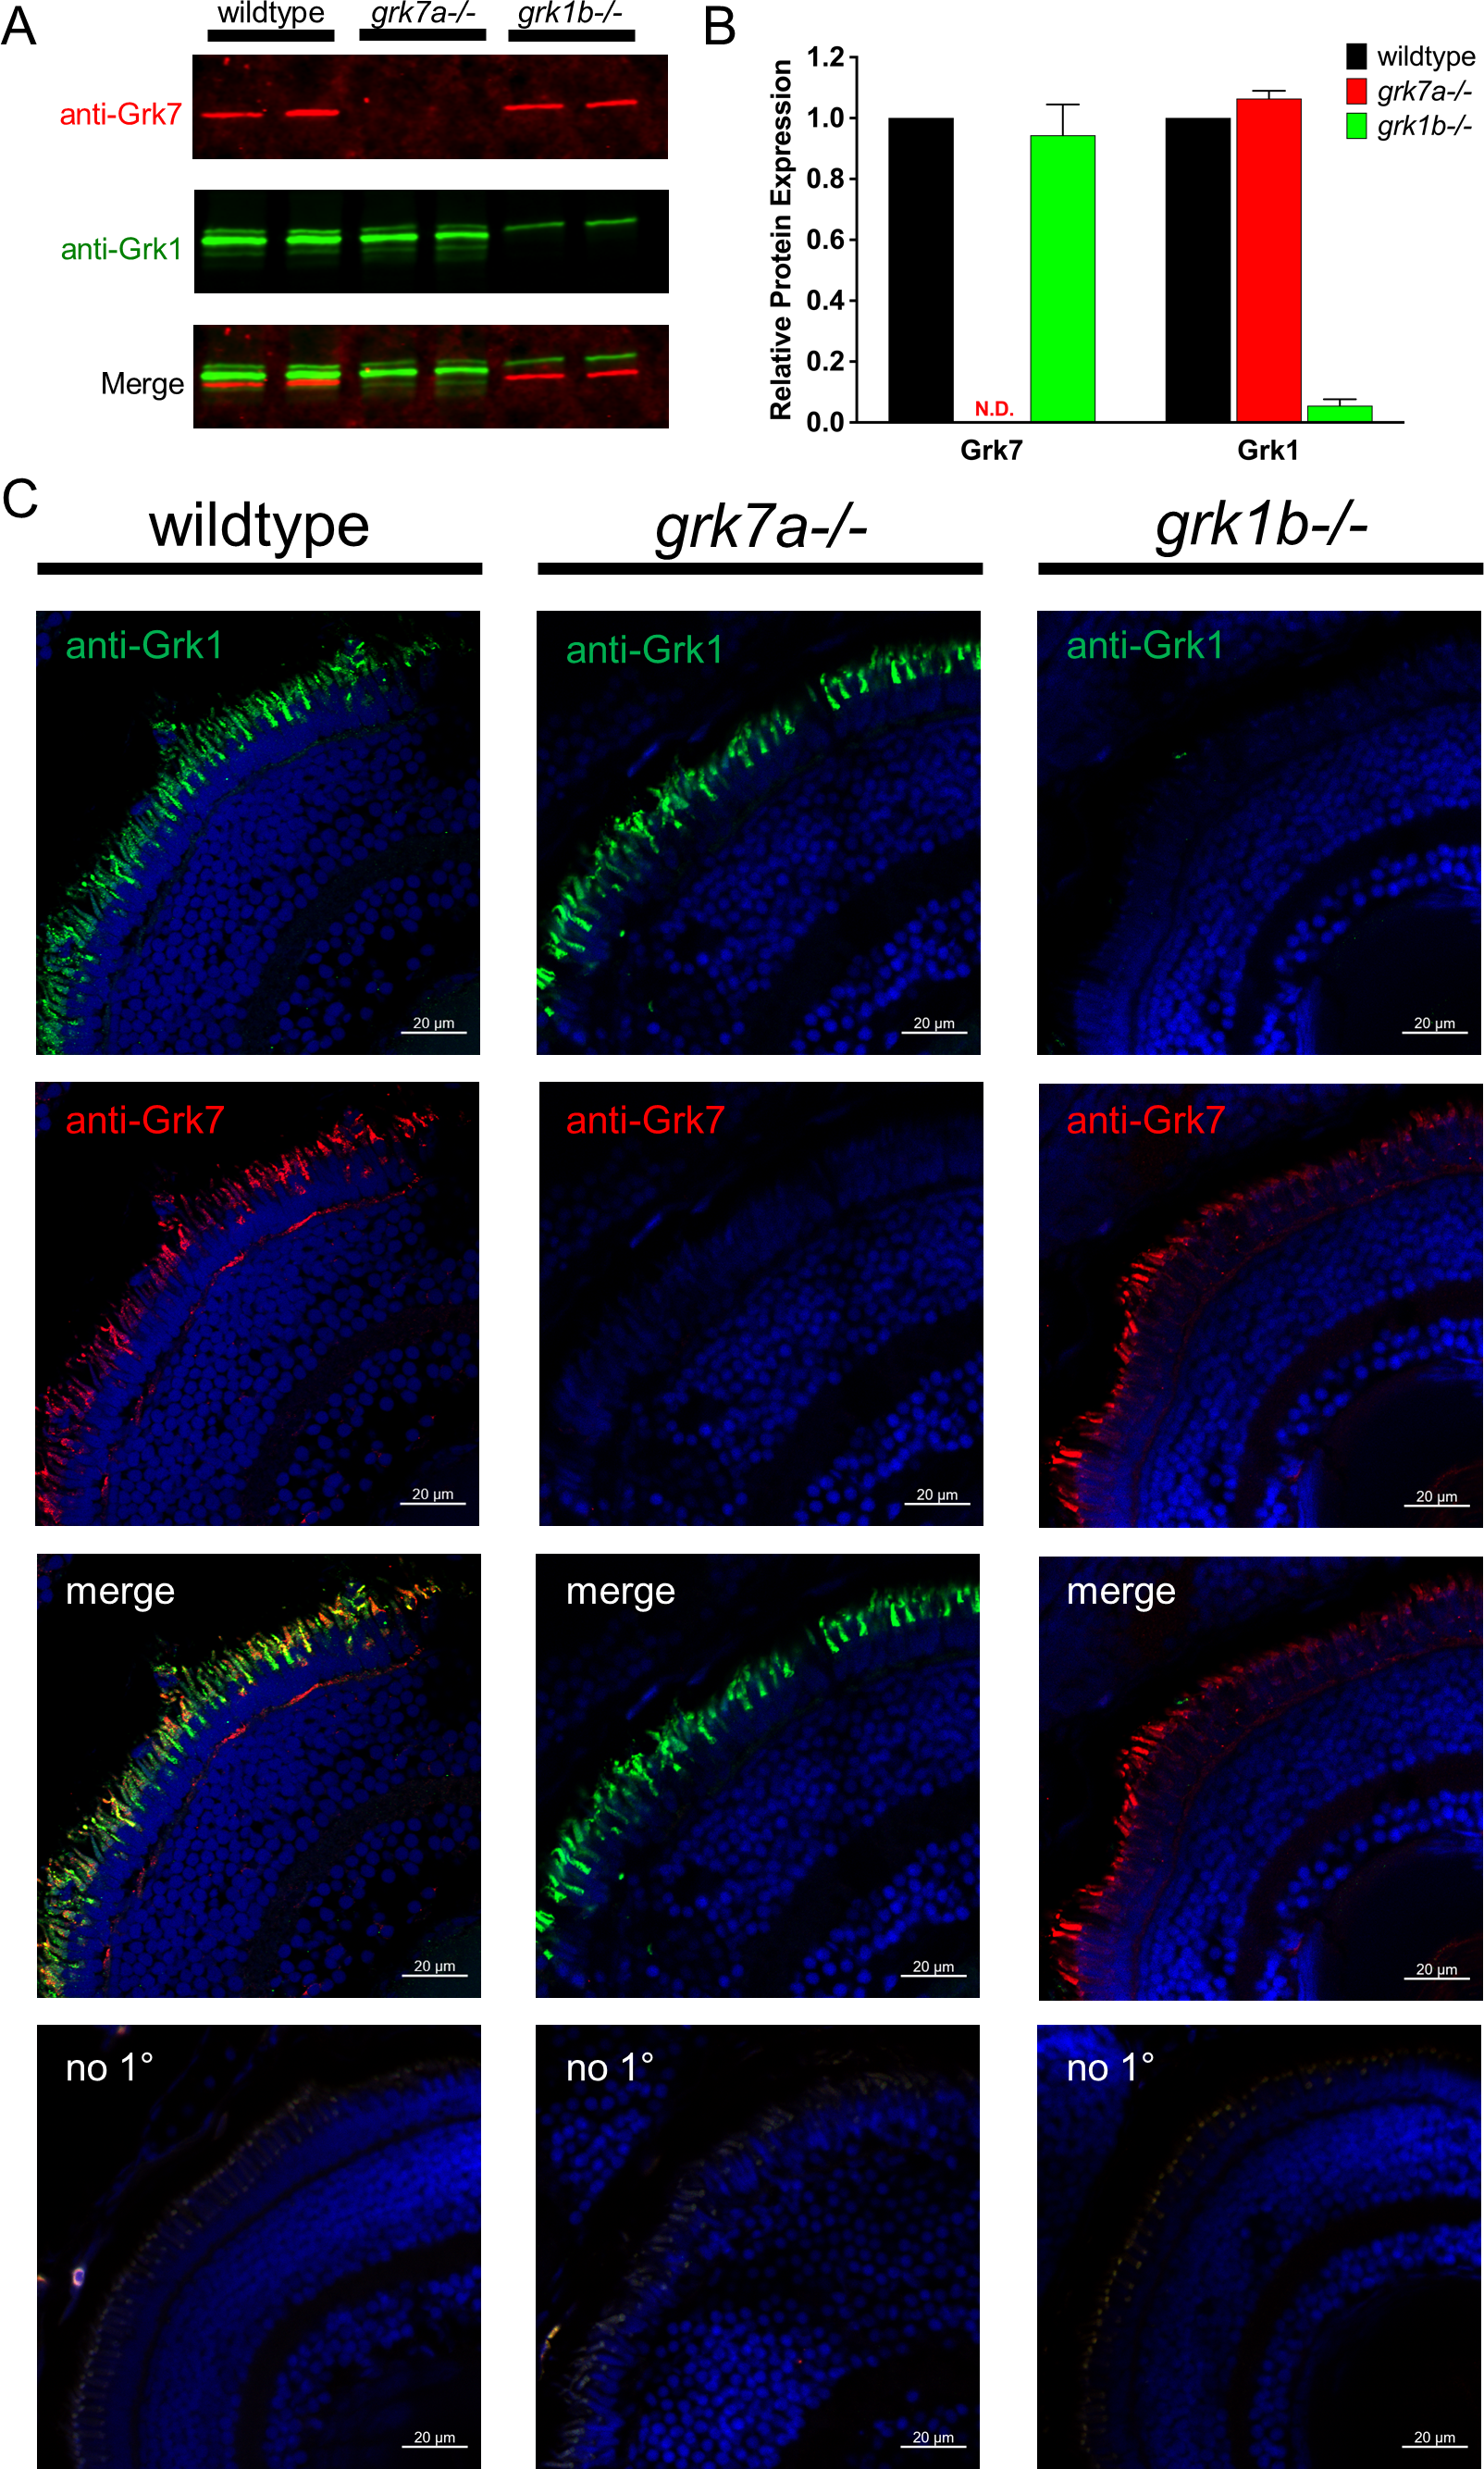
Fig. 2
Detection of Grk1b and Grk7a in knockout larvae. (A) Immunoblot analysis of tissue homogenates isolated from heads of light-adapted wildtype, grk7a−/−, and grk1b−/− larvae at 5 dpf. 40 μg of each sample were loaded per lane. Immunoblots were probed with antibodies against Grk7 (red) and Grk1 (green) followed by incubation with secondary antibodies as described in “Methods.” (B) Relative expression of total Grk1 and Grk7 in knockout lines compared to wildtype larvae at 5 dpf was quantified from the data in (A). All samples were normalized to β-actin immunoreactivity. Bars represent the range of duplicate samples. N.D., none detected. (C) Immunocytochemical analysis of knockout larvae at 5 dpf. Light-adapted larvae were fixed, cryoembedded, and sectioned as described in “Methods.” Sections were probed with anti-Grk7 (red) and anti-Grk1 (green) at a dilution of 1:1000, followed by incubation in secondary antibodies conjugated to AlexaFluor488 and AlexaFluor594, respectively at a dilution of 1:1500.
Figure Data
Acknowledgments
This image is the copyrighted work of the attributed author or publisher, and
ZFIN has permission only to display this image to its users.
Additional permissions should be obtained from the applicable author or publisher of the image.
Full text @ Invest. Ophthalmol. Vis. Sci.