
- Title
-
Hypoxia Delays Oligodendrocyte Progenitor Cell Migration and Myelin Formation by Suppressing Bmp2b Signaling in Larval Zebrafish
- Authors
- Yang, L.Q., Chen, M., Zhang, J.L., Ren, D.L., Hu, B.
- Source
- Full text @ Front. Cell. Neurosci.

ZFIN is incorporating published figure images and captions as part of an ongoing project. Figures from some publications have not yet been curated, or are not available for display because of copyright restrictions. EXPRESSION / LABELING:
PHENOTYPE:
|
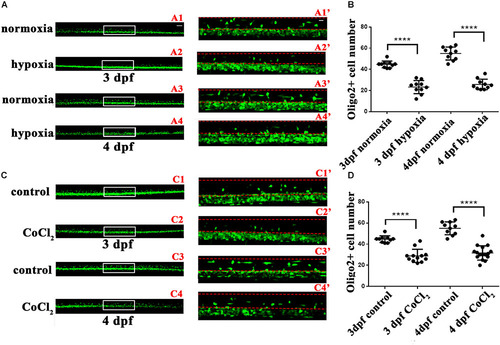
Hypoxia and CoCl2⋅6H2O suppressed OPC migration to the dorsal area. The number of dorsally migrated spinal cord olig2+ cells was counted in Tg (olig2: EGFP) zebrafish using a 10 × objective lens on a FV1000 microscope (Olympus, Tokyo, Japan). (A,B) The number of dorsally migrated olig2+ cells decreased under hypoxia at 3 and 4 dpf. A1′, A2′, A3′, and A4′ are the magnified pictures of the white boxes in A1, A2, A3, and A4. Two-way ANOVA, P < 0.0001: Student’s two-tailed t-test. Significantly more cells were dorsally migrated in 3-dpf normoxic larvae as compared to 3-dpf hypoxic larvae (n = 10; P < 0.0001). Significantly more cells were dorsally migrated in 4-dpf normoxic larvae as compared to 4-dpf hypoxic larvae (n = 10; P < 0.0001). (C,D) The number of dorsally migrated spinal cord olig2+ cells in 3- and 4-dpf larvae decreased after CoCl2⋅6H2O exposure. C1′, C2′, C3′, and C4′ are the magnified pictures of the white boxes in C1, C2, C3, and C4. Two-way ANOVA, P < 0.0001: Student’s two-tailed t-test. Significantly more cells were dorsally migrated in 3-dpf normoxic larvae as compared to 3-dpf hypoxic larvae (n = 10; P < 0.0001). Significantly more cells were dorsally migrated in 4-dpf normoxic larvae as compared to 4-dpf hypoxic larvae (n = 10; P < 0.0001). The dashed line indicates the dorsal spinal cord. Scale bars: A1–A4 and C1–C4, 50 μm; A1′–A4′, and C1′–C4′, 10 μm. ∗P < 0.05; ∗∗P < 0.01; ∗∗∗P < 0.001. Error bars represent S.E.M. EXPRESSION / LABELING:
PHENOTYPE:
|
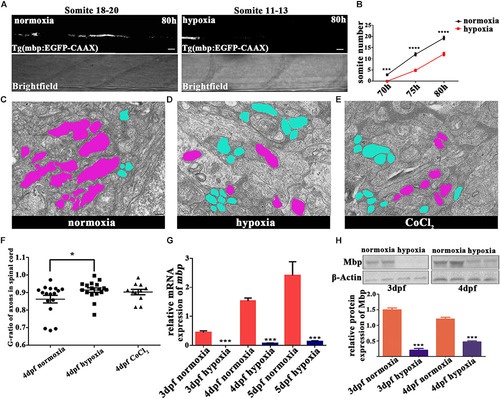
Hypoxia delayed the onset of myelination and led to thinner myelin sheaths. (A) Myelination of the Mauthner axon, the most posterior myelin sheath in the spinal cord, at 80 hpf. Myelination can be seen between somites 18 and 20 in normoxic animals but between somites 11 and 13 in hypoxic animals. Scale bars: 10 μm. (B) The most posterior myelin sheath at 70 hpf is somite 2.875 ± 0.3981 in normoxic animals (n = 8) and somite 0.0 ± 0.0 in hypoxic animals (n = 8); at 75 hpf is somite 12.00 ± 0.6814 in normoxic animals (n = 8) and somite 4.857 ± 0.5084 in hypoxic animals (n = 7); and at 80 hpf is somite 19.27 ± 0.7519 in normoxic animals (n = 8) and somite 12.13 ± 0.7892 in hypoxic animals (n = 7). Two-way ANOVA, P < 0.0001. (C–E) A large number of unmyelinated axons (shaded in blue) were observed in the spinal cord axons of the hypoxic and CoCl2 groups as compared to the myelinated axons (shaded in purple) observed in the normoxic group. Scale bars: 200 nm. (F) The hypoxic group had a higher G-ratio in the spinal cord axon than did the normoxic group, indicating delayed-onset myelination under hypoxia. One-way ANOVA, P < 0.05. (G) qRT-PCR analysis indicated that myelin basic protein (mbp) mRNA transcription was significantly decreased under hypoxia. (H) The expression of the Mbp protein was analyzed with western blots. The results showed that hypoxia blocked Mbp protein translation. Larvae at 3 and 4 dpf (30 per day) were pooled for western blot experiments. ∗P < 0.05; ∗∗P < 0.01; ∗∗∗P < 0.001; ∗∗∗∗P < 0.0001. EXPRESSION / LABELING:
PHENOTYPE:
|
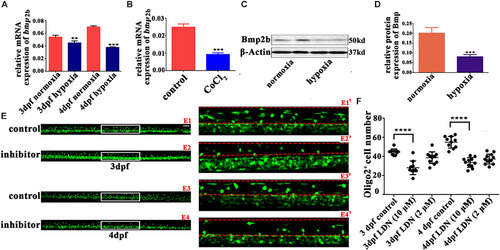
The Bmp2b inhibitor suppresses OPC migration to the dorsal area. (A,B) qRT-PCR analysis indicated that bmp2b gene mRNA expression was significantly downregulated after hypoxia and CoCl2 exposure. (C,D) Bmp2b protein expression was analyzed with western blots. The results showed that hypoxia blocked Bmp2b protein translation. Thirty zebrafish 4-dpf larvae were pooled for western blots experiments. (E,F) The number of dorsally migrated olig2+ cells at 3 and 4 dpf decreased after LDN193189 treatment. E1′, E2′, E3′, and E4′ are magnified pictures of the white boxes in E1, E2, E3, and E4. Scale bars: E1–E4, 50 μm and E1′–E4′, 10 μm. Two-way ANOVA, P < 0.0001: Student’s two-tailed t-test. Significantly more cells were dorsally migrated in 3-dpf control larvae as compared to 3-dpf larvae treated with 10 μM LDN193189 (n = 12; P < 0.0001). Significantly more cells were dorsally migrated in 4-dpf normoxic larvae as compared to 4-dpf larvae treated with 10 μM LDN193189 (n = 10; P < 0.0001). ∗P < 0.05; ∗∗P < 0.01; ∗∗∗P < 0.001; ∗∗∗∗P < 0.0001. Error bars represent S.E.M. EXPRESSION / LABELING:
PHENOTYPE:
|
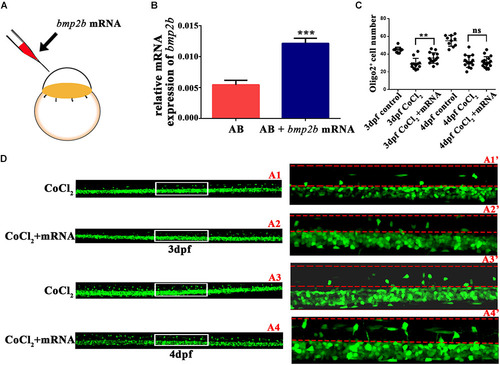
Bmp2b mRNA reversed the reduction in the number of olig2+ cells migrating to the dorsal area. (A) Bmp2b mRNA was injected into one-cell embryos. (B) qRT-PCR analysis showed that bmp2b gene expression increased, validating the rescue effect. (C–D) bmp2b mRNA reversed the reduction in the number of dorsally migrated olig2+ cells at 3 and 4 dpf. A1′, A2′, A3′, and A4′ are the magnified pictures of the white boxes in A1, A2, A3, and A4. Scale bars: A1–A4, 50 μm and A1′–A4′, 10 μm. ∗P < 0.05; ∗∗P < 0.01; ∗∗∗P < 0.001. Error bars represent S.E.M. EXPRESSION / LABELING:
PHENOTYPE:
|