
- Title
-
A Zebrafish Acromegaly Model Elevates DNA Damage and Impairs DNA Repair Pathways
- Authors
- Elbialy, A., Asakawa, S., Watabe, S., Kinoshita, S.
- Source
- Full text @ Biology (Basel)
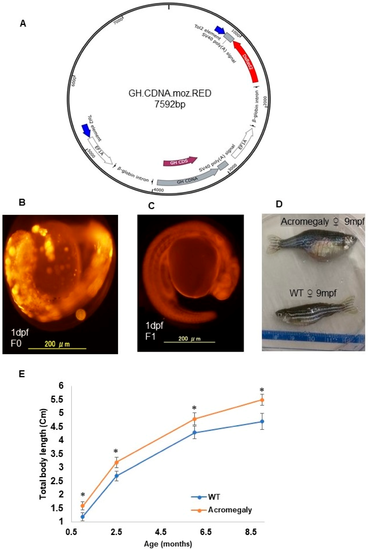
Production of the acromegaly zebrafish model overexpressing tilapia GH. ( A) The structure of the GH-CDNA-moz-RED construct used to produce acromegaly zebrafish. The blue arrows indicate Tol2 transposable element. EF1A promoters drive expression of Tilapia GH cDNA and DsRed2 CDS. ( B) Acromegaly zebrafish F0 generation larvae (1 dpf) showing mosaic expression of red fluorescent protein (RFP) reporter gene expression. ( C) Acromegaly zebrafish F1 generation larvae (1 dpf) showing homogenous expression of red fluorescent protein (RFP) reporter gene expression in the whole body. ( D) Representative female acromegaly zebrafish F1 generation (9 mpf) showing a progressive increase in growth rate compared to wild-type (WT). ( E) Shown are growth curves represented as the total body length of fish recorded from one month till nine months of age between eight F1 Acromegaly zebrafish (four males and four females) and eight WT zebrafish (four males and four females). Data are expressed as the mean ± SE (n = 8). Statistical differences (t-test, P < 0.05) are denoted by asterisks. dpf: days post-fertilization, mpf: months post-fertilization.
Construct:
Tg(Xla.Eef1a1:Omo.Gh,Xla.Eef1a1:DsRed2)
|
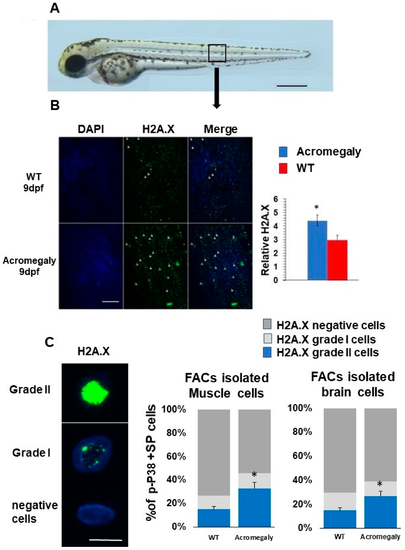
Increased DNA damage in Acromegaly zebrafish larvae and adult. (A) A zebrafish larva showing the area for taking the image for H2A.X quantification (black box). Bar = 500 µm. (B) Representative H2A.X whole-mount immunostaining and quantification in acromegaly and WT zebrafish (9 dpf) showing a significant increase in the number of H2A.X stained cell nuclei in the acromegaly zebrafish model. Arrows in panel B show H2A.X stained cell nuclei. Bar = 40 µM. Quantification was performed using Fiji software. (C) Representative H2A.X grade I, grade II, and negatively stained cells. Bar = 5 µM (left). Quantification of H2A.X positive and negative stained live isolated cells from the muscle and brain of acromegaly and WT (one-year-old) fish (left). Data are expressed as the mean ± SE (n = 3). Statistical difference (t-test, P < 0.05) is denoted by an asterisk. |
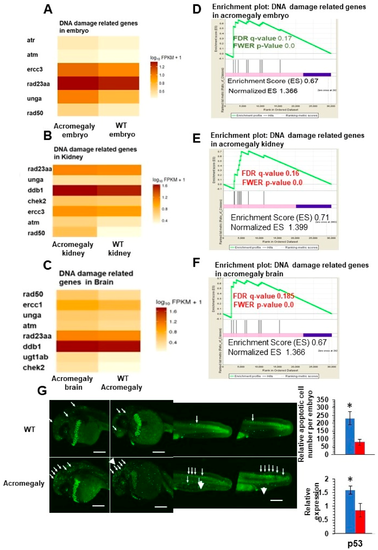
Increased DNA damage in various organs of acromegaly zebrafish model. (A–C) Heatmap of DNA damage markers in acromegaly larvae (3 dpf) (A), acromegaly kidney (one-year-old) (B), and acromegaly brain (one-year-old) (C) versus WT. (D–F) The results of GSEA showing the familywise-error rate (FWER) p-values, false discovery rate (FDR), enrichment scores (ES), and normalized ES of DNA damage markers in acromegaly larvae (3 dpf) (D), acromegaly kidney (one-year-old) (E), and acromegaly brain (one-year-old) (F) versus WT. Significant p-value < 0.05 and FDR q-value < 0.25 are written in red. According to GSEA [15], the reported p-value of 0.0 indicates an actual p-value of less than 0.01 (G) Representative Acridine orange (AO) staining and quantification of acromegaly model and WT larvae. The quantification of AO positive apoptotic cells was performed using Fiji software (left). P53 expression levels in the acromegaly model and WT larvae (right). Data are expressed as the mean ± SE (n = 3). Statistical difference (t-test, P < 0.05) is denoted by an asterisk. EXPRESSION / LABELING:
PHENOTYPE:
|

Unillustrated author statements EXPRESSION / LABELING:
PHENOTYPE:
|