
- Title
-
foxr1 is a novel maternal-effect gene in fish that is required for early embryonic success.
- Authors
- Cheung, C.T., Patinote, A., Guiguen, Y., Bobe, J.
- Source
- Full text @ Peer J.
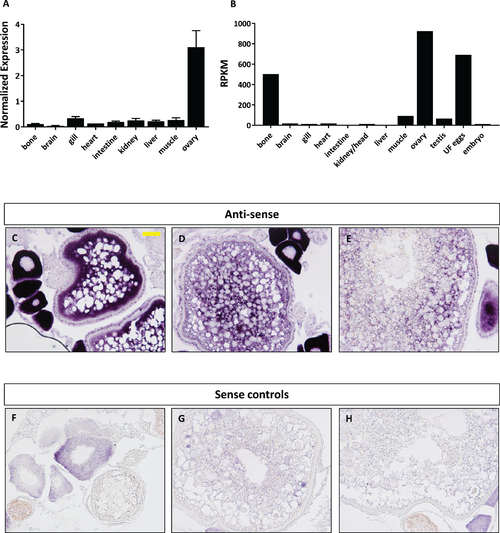
Expression profile of foxr1 in zebrafish. Tissue expression analysis of foxr1 mRNA in adult zebrafish (A) by quantitative real-time PCR (qPCR) and (B) RNA-seq. Expression level by qPCR is expressed as a normalized value following normalization using 18S, β-actin, and ef1α expression while that by RNA-seq is expressed in read per kilobase per million reads (RPKM). Tissues were harvested from three to four wildtype zebrafish individuals. (C–H) In situ hybridization was performed for foxr1 in zebrafish ovaries from wildtype females. Positive staining is demonstrated using the anti-sense probe against foxr1 (Figs 3C–3E) in blue with 5-bromo-4-chloro-3-indolyl-phosphate/nitro blue tetrazolium as substrate. The negative control was performed with the sense probe (Figs 3F–3H). About 20× magnification; scale bar denotes 90 μm. N = 5 each for foxr1 mutant and control. UF, unfertilized. EXPRESSION / LABELING:
|
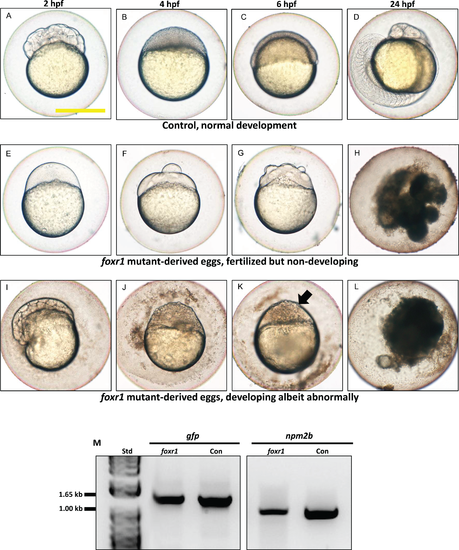
Effect of foxr1 deficiency on zebrafish embryogenesis. Representative images demonstrating development of fertilized eggs from crosses between control (A–D) and foxr1 (E–L) females and vasa::gfp males from 2 to 24 h post-fertilization (hpf). In the control eggs, the embryos were at 64-cell (A), oblong (B), germ ring (C), and 24-somite (D) stages according to Kimmel et al. (1995). Eggs from foxr1 mutant females were non-developing with a non-cellularized morphology (E–H) or developing with an abnormal morphology (I–L). (A, E, I) = images taken at two hpf; (B, F, J) = images taken at four hpf; (C, G, K) = images taken at six hpf; (D, H, L) = images taken at 24 hpf. Scale bar denotes 500 μm. The arrow demonstrates an abnormally cellularized blastodisc that was sitting atop an enlarged syncytium. (M) Genotypic analysis of the eggs from crosses of foxr1 mutant females and vasa::gfp males to determine fertilization status. The gfp and vasa primers produced a band that was 1,333 base pairs in size. Detection of the npm2b gene (band size = 850 base pairs) was used as a control. Con = eggs from crosses of wildtype females with vasa::gfp males; foxr1 = eggs from crosses of foxr1 mutant females with vasa::gfp males. N = 5 each for foxr1 mutant and control. |