
|
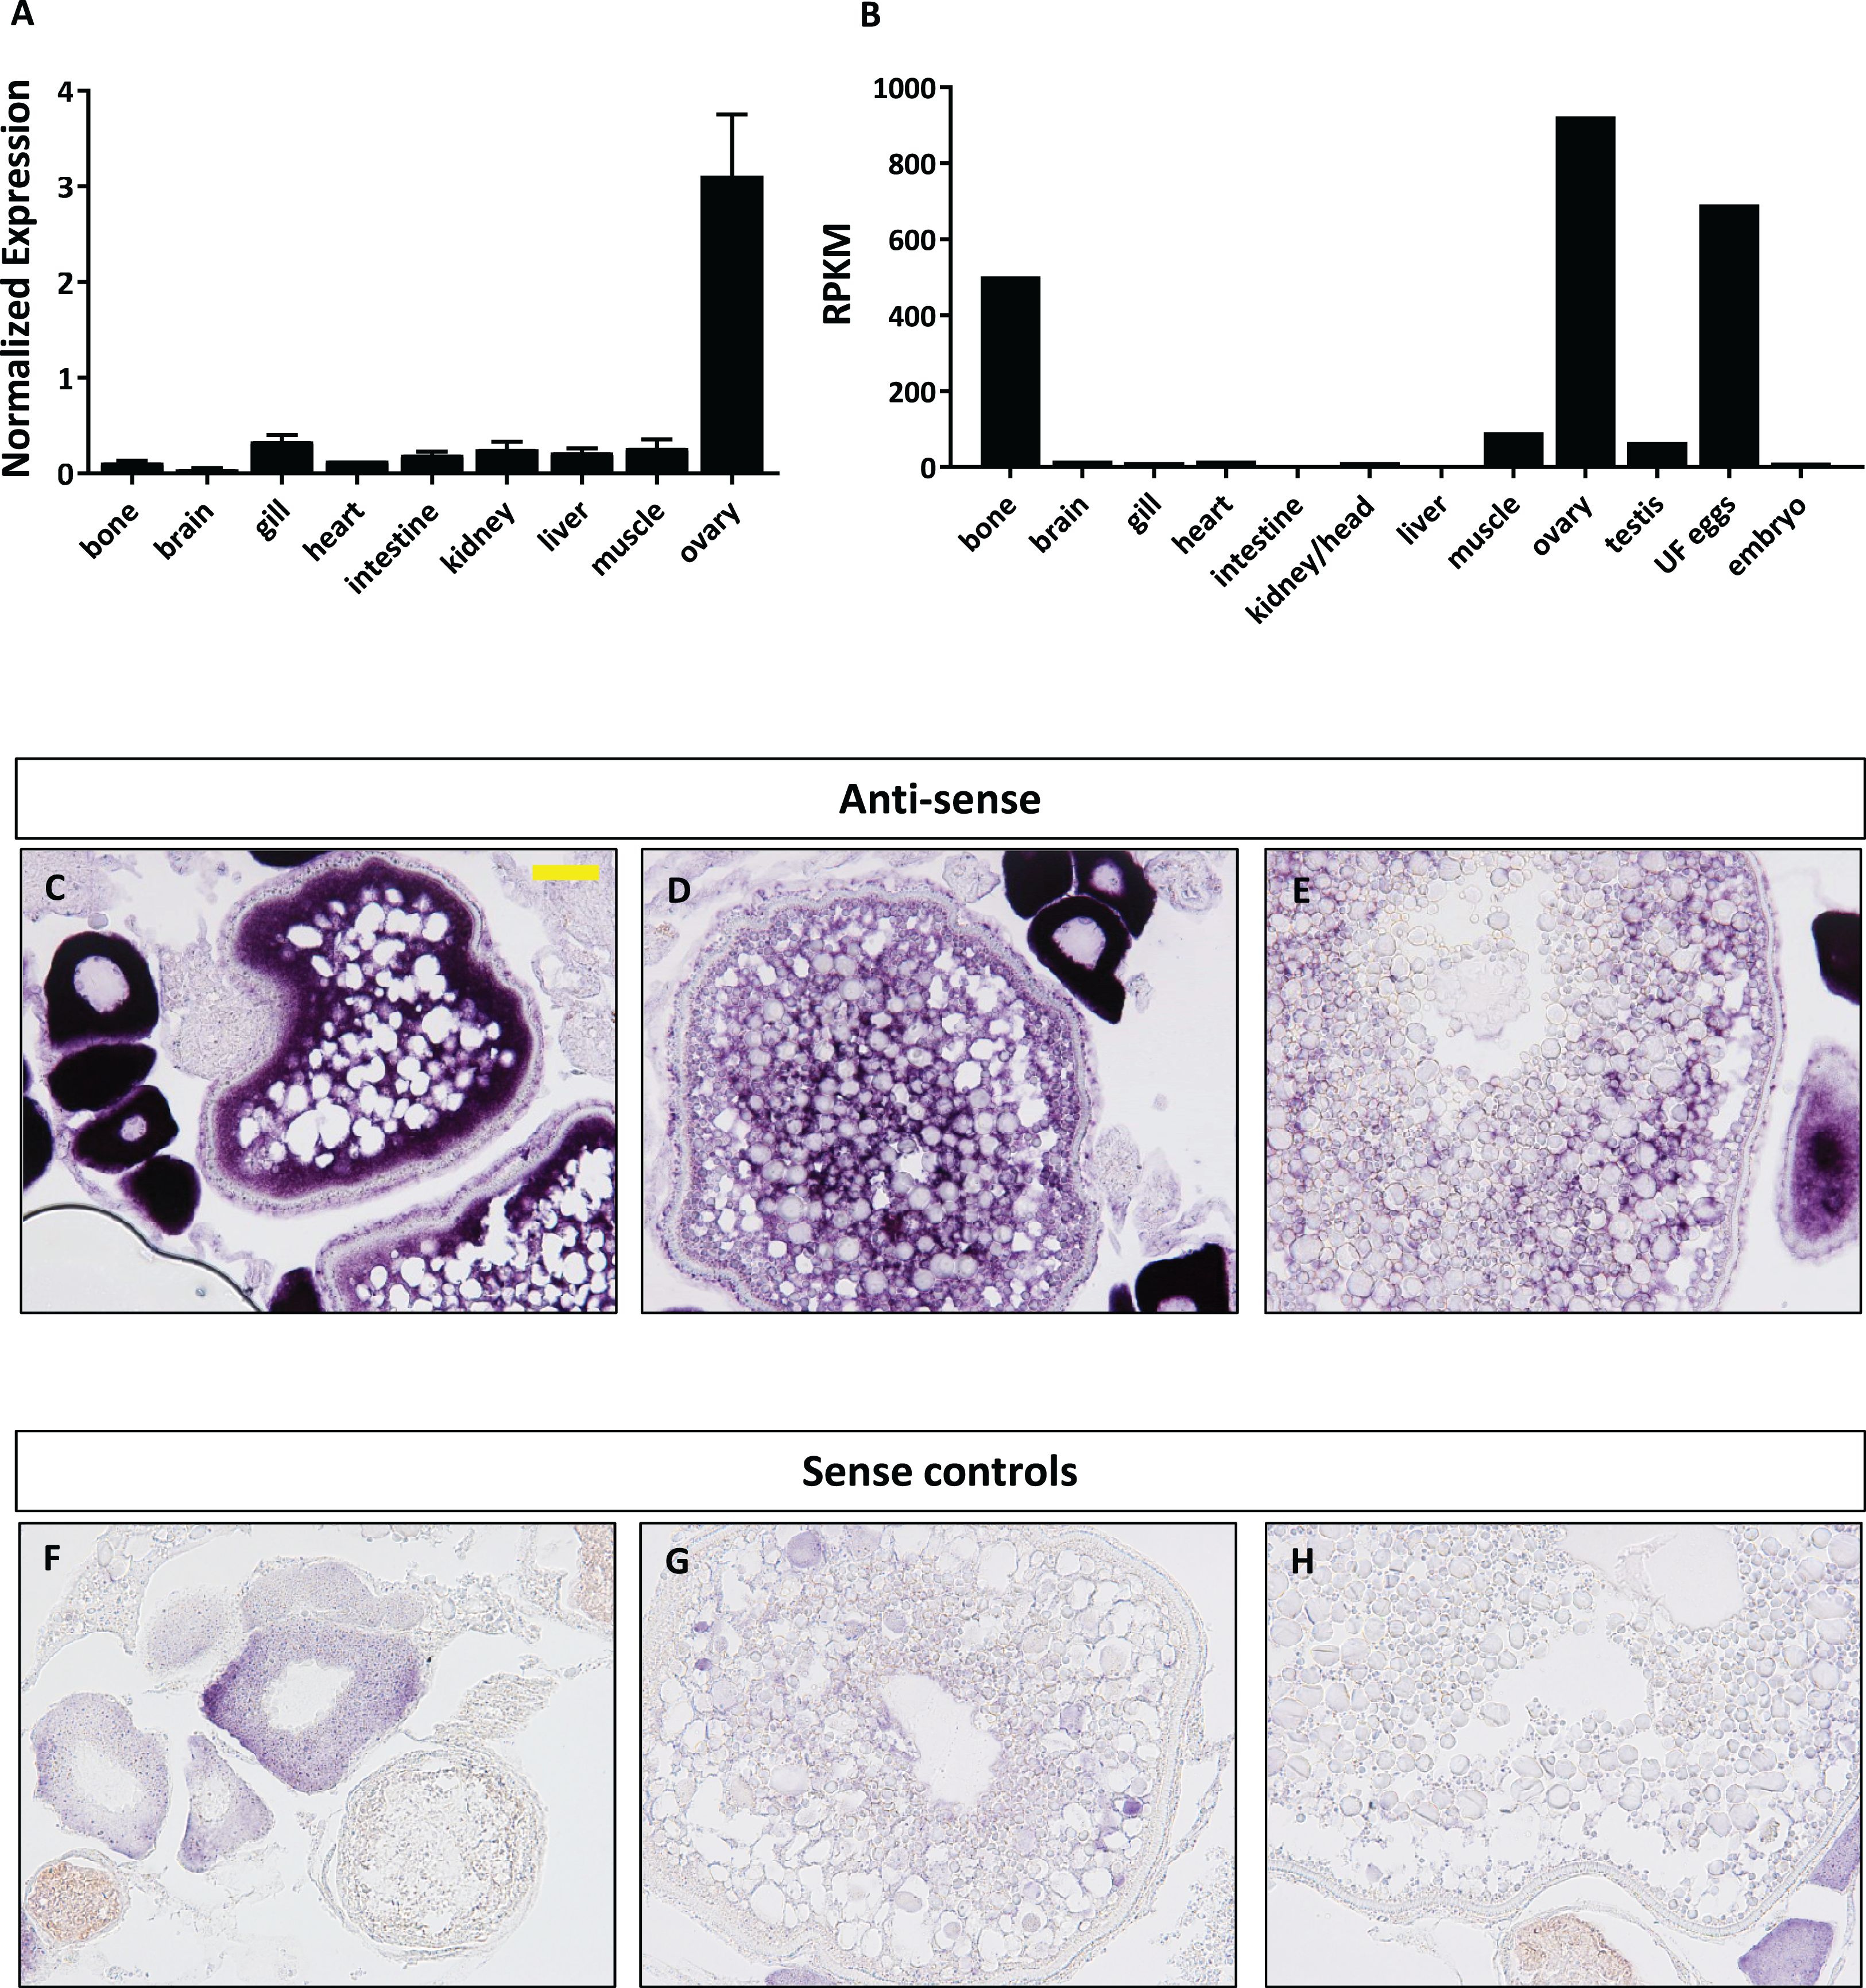
Fig. 3
Expression profile of foxr1 in zebrafish.
Tissue expression analysis of foxr1 mRNA in adult zebrafish (A) by quantitative real-time PCR (qPCR) and (B) RNA-seq. Expression level by qPCR is expressed as a normalized value following normalization using 18S, β-actin, and ef1α expression while that by RNA-seq is expressed in read per kilobase per million reads (RPKM). Tissues were harvested from three to four wildtype zebrafish individuals. (C–H) In situ hybridization was performed for foxr1 in zebrafish ovaries from wildtype females. Positive staining is demonstrated using the anti-sense probe against foxr1 (Figs 3C–3E) in blue with 5-bromo-4-chloro-3-indolyl-phosphate/nitro blue tetrazolium as substrate. The negative control was performed with the sense probe (Figs 3F–3H). About 20× magnification; scale bar denotes 90 μm. N = 5 each for foxr1 mutant and control. UF, unfertilized.