
- Title
-
Liver-directed microRNA-7a depletion induces nonalcoholic fatty liver disease by stabilizing YY1-mediated lipogenic pathways in zebrafish
- Authors
- Lai, C.Y., Lin, C.Y., Hsu, C.C., Yeh, K.Y., Her, G.M.
- Source
- Full text @ Biochim. Biophys. Acta

Design and validation of a miR-7a-sponge (miR7a-SP). (A) Alignment of the mature miR-7 sequence is perfectly conserved across many species, including honey bee (Apis mellifera; ame-miR-7), dog (Canis familiaris; cfa-miR-7), fruit fly (Drosophila melanogaster; dme-miR-7), zebrafish (Danio rerio; dre-miR-7a1-3), humans (Homo sapiens; hsa-miR-7), rhesus monkey (Macaca mulatta; mml-miR-7), mouse (Mus musculus; mmu-miR-7a), chimpanzee (Pan troglodytes; ptr-miR-7), rat (Rattus norvegicus; rno-miR-7) and frog (Xenopus tropicalis; xtr-miR-7). (B) Cloning of pri-miR-7a and miR7a-SP into b-Act expression vectors. Stem-loop structure of premiR-7a is shown, in which mature miR-7a is highlighted in red. (C) In vitro EGFP reporter assays were performed to confirm the direct interaction between miR-7a and the target sequences. ZFL, ZEM2S, and SOB-15 cells were transfected with pb-Act-eGFP-mir-7a-TS and pb-Act-eGFP-mir-7a or pb-Act-eGFP-mir-7a-SP plasmids, and the EGFP intensity was measured. **p < 0.01 and *p < 0.05. (D) In vivo EGFP reporter assays were performed to confirm the direct interaction between miR-7a and the target sequences in 6 dpf zebrafish larvae. |

Generation of miR-7a-sponge transgenic zebrafish. (A) Cloning of pri-miR-7a and miR7a-SP into LF2.8 expression vectors. Stem-loop structure of premiR-7a, in which mature miR-7a is highlighted in red. (B) Red fluorescent images of C7aSP expression in the entire body of bC7aSP (1, 9 pdf, magnification 40×, scale bars: 200 μm; 2, 4 mpf, magnification 40×, scale bars: 100 mm) and the livers of hC7aSP1 (3, 9 pdf, magnification 40×, scale bars: 200 μm; 4, 4 mpf, magnification 40×, scale bars: 100 mm). (C) Stem-loop RT-qPCR analysis of mature miR-7a of the liver, brain, intestine, and muscle tissues from the three transgenic lines, bC7aSP and hC7aSP1 and 2. ** |

Effect of C7aSP on hC7aSPs and bC7aSP liver and intravascular lipids through Oil Red O (ORO) staining. (A–E) Lateral view of the whole-mount ORO staining of representative larvae. Enlargement at the trunk and posterior level is shown in panels ′ and ″. WT larva fed with LFD (A) and with HDF (B). hC7aSP1 larva fed with LFD (C). hC7aSP2 larva fed with LFD (D). bC7aSP1 larva fed with LFD (E). (F) The percentages of hC7aSPs and bC7aSP larvae with steatosis and intravascular lipids was calculated through ORO staining. The ORO staining was performed in triplicate with on average 60–80 larvae per groups. The asterisk represents statistically significant differences; * p < 0.01, and ** p < 0.005. Abbreviations: e, eye; da, dorsal aorta; dlav, dorsal longitudinal anastomotic vessel; h, heart; i, intestine; isv, intersegmental vessel; pcv, posterior cardinal vein; sb, swim bladder; ys, yolk sac. Scale bar, 200 μm in panels A–E; 50 μm in panels A′–E′; 100 μm in panels A″–E″. PHENOTYPE:
|
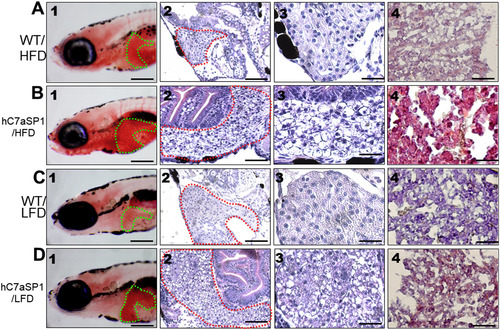
Liver histological changes of hC7aSP1 zebrafish larvae at different quantities of feeding and lipid contents. The histological changes in the liver of zebrafish larvae fed with HFD (A) for WT and (B) for hC7aSP1. The histological changes in the liver of zebrafish larvae fed with LFD (C) for WT and (D) for hC7aSP1. Zebrafish larvae were analyzed using whole-mount ORO (1, magnification 50×, scale bars: 200 μm), H&E staining (2, magnification 200×, scale bars: 100 μm), H&E staining (3, magnification 400×, scale bars: 20 μm) and frozen section ORO staining (frozen ORO) (4, magnification 400×, scale bars: 10 μm). |
|
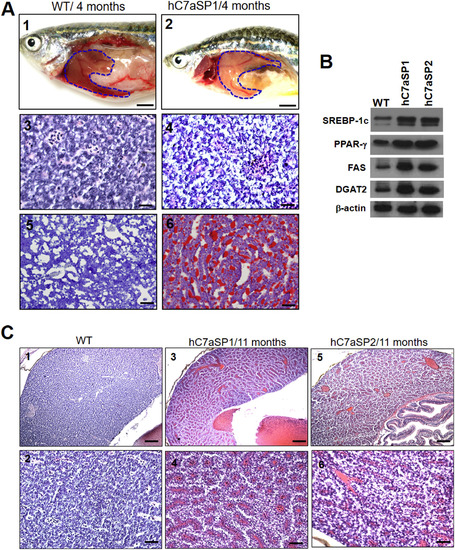
NAFLD and NASH phenotypes observed in hC7aSPs adults. (A) Representative gross anatomy of the liver of 4-month-old WT (1) and hC7aSP1 (2) adults magnification (40×, scale bars: 20 mm). H&E stained livers of the WT (3, magnification 400×, scale bars: 20 μm) and hC7aSP1 (4, magnification 400×, scale bars: 20 μm) indicate that vacuoles in hepatocytes were increased in hC7aSP1. Lipid accumulation was confirmed through ORO-stained sections from adult WT (5, magnification 400×, scale bars: 10 μm) and hC7aSP1 liver tissues (6, magnification 400×, scale bars: 10 μm). (B) Western blot for two lipogenic factors, SREBP-1c and PPAR-γ, and two lipogenic enzymes, FAS and DGAT2, in the liver of WT and hC7aSPs adults. (C) Representative images of H&E staining of the 11-month-old WT (1, magnification 100×, scale bars: 10 μm; 2, magnification 400×, scale bars: 25 μm), hC7aSP1 (3, magnification 100×, scale bars: 10 μm; 4; magnification 400×, scale bars: 25 μm) and hC7aSP2 (5, magnification 100 × scale bars: 10 μm; 6, magnification 400×, scale bars: 25 μm) livers, demonstrating induced liver stress and damage in hC7aSPs compared with WT at the same stage. (D) Levels of hepatic MDA, and (E) H2O2 in hepatic mitochondria was compared between hC7aSPs and WT adults. (F) Expression of inflammatory genes, il-1b, il-6, tnf-α, ifn-γ, nfkb2, and NF-kB, is increased. (G) Expression of endoplasmic reticulum (ER) stress markers, atf6, ern2, ire1, prek, hspa5, grp78, and ddit3, is also increased. Levels of mRNA were normalized to β-actin and expressed as fold of values in the WT control. **p < 0.01; *p < 0.05. 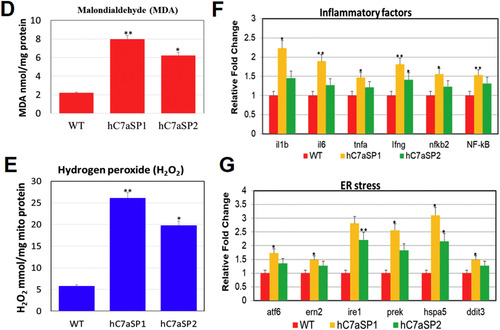
|
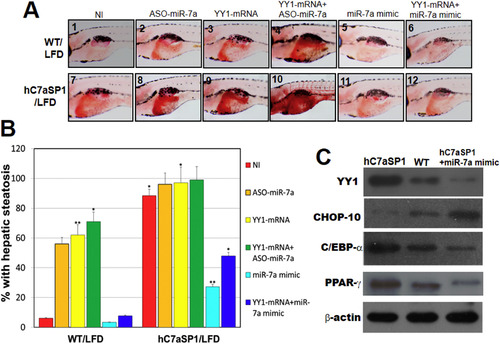
Inhibition of YY1 expression rescues the NAFLD phenotypes in hC7aSP1 larvae. (A) Steatotic analyses of 9 dpf WT and hC7aSP1 larvae. Embryos without injection (NI) and those injected with 4 ng ASO-miR-7a, 200 pg YY1 mRNA, 100 pg YY1 mRNA + 2 ng ASO-miR-7a, 6 ng miR-7a-mimic, and 100 pg YY1 mRNA + 3 ng miR-7a-mimic were analyzed at the embryonic stage of 7 dpf. (B) Quantification of hepatic steatosis of WT and hC7aSP1 larvae in (A) fed with LFD. Percentages of each category in the WT and hC7aSP1 larvae in (A) are presented. The total number (N) of larvae in each group is indicated (n = 40–50 for each groups). *p < 0.01, and **p < 0.005. (C) Western blot analyses of YY1 depletive efficiency. WT and hC7aSP1 embryos without injection (NI) and those injected with 8 ng miR-7a-mimic were harvested at 9 dpf. β-Actin was used as the loading control. |

PPAR-γ antagonists and miR-7a mimic treatment ameliorate NAFLD and NASH phenotypes in hC7aSP1 fed with LFD. (A) Steatotic analyses of 9 dpf WT and hC7aSP1r larvae. Embryos without injection (NI) and those injected with 200 pg PPAR-γ mRNA, 150 pg C/EBP-α mRNA, and 200 pg CHOP-10 mRNA were analyzed at the embryonic stage of 7 dpf. (B) Quantification of hepatic steatosis of WT and hC7aSP1 is shown in (A). The total number (N) of larvae in each group is indicated. (C) Western blot analyses of CHOP-10 ectopic efficiency. hC7aSP1 larvae and WT embryos without injection (NI) and those injected with 200 pg CHOP-10 mRNA were harvested at 9 dpf. β-Actin was used as the loading control. (D) Gross anatomy of liver and frozen liver section ORO staining in hC7aSP1 adults treated with miR-7a mimic, Gw9962, ASX, miR-7a mimic + GW9962, and miR-7a mimic + GW9962 (rescued hC7aSP1). (E) qRT-PCR analysis of selected lipogenic genes in the livers of rescued hC7aSP1. (F) qRT-PCR analysis of selected NASH-like genes in the livers of rescued hC7aSP1. Levels of mRNA were normalized to β-actin and expressed as fold of values in the WT control. **p < 0.01; *p < 0.05. |

ZFIN is incorporating published figure images and captions as part of an ongoing project. Figures from some publications have not yet been curated, or are not available for display because of copyright restrictions. |