
- Title
-
Projections of the Diencephalospinal Dopaminergic System to Peripheral Sense Organs in Larval Zebrafish (Danio rerio).
- Authors
- Haehnel-Taguchi, M., Fernandes, A.M., Böhler, M., Schmitt, I., Tittel, L., Driever, W.
- Source
- Full text @ Front. Neuroanat.
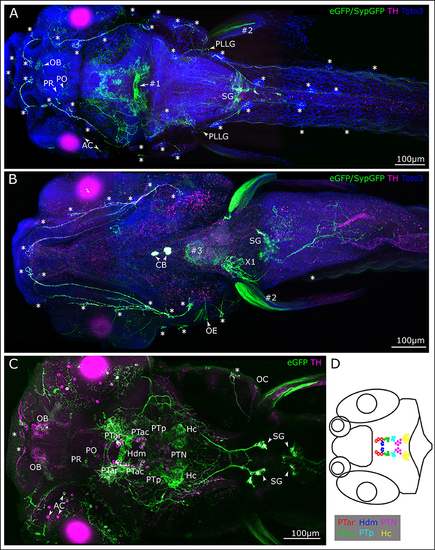
Membrane-tagged GFP expression in 6 dpf th:Gal4VP16, UAS:GFP-CAAX larvae identifies peripheral catecholaminergic projections. (A–C) Whole mount immunofluorescence detection of GFP and TH in Tg(th:Gal4-VP16)m1233, Tg(UAS:eGFP-CAAX)m1230, Tg(UAS:SypGFP)m1238 transgenic larvae. Images show maximum intensity projections (MIP) from confocal optical sections of larval head and trunk. TH immunoreactivity validates catecholaminergic cells with GFP expression. The immunostain reveals DA cell clusters in the ventral diencephalon/posterior tuberculum (PT) and hypothalamus, in the pretectum (PR), preoptic region (PO) and olfactory bulb (OB), in a subset of amacrine cells (AC) in the retina, as well as noradrenergic hindbrain neurons and sympathetic ganglia (SG). Arrowheads point at structures as indicated by adjacent labels. Central DA projections are labeled throughout the brain and in the spinal cord. Note that GFP expression levels in the transgenic line do not correlate with levels of TH expression, and GFP expression is often found only in a mosaic fashion in a subset of TH positive cells. In the Tg(th:Gal4-VP16)m1233 line, at 6 dpf ectopic GFP expression occurs in a commissure at the border between mes- and rhombencephalon (#1) and in pectoral fin muscles (#2). GFP expression stemming from the heart marker of the Tg(UAS:Syp-GFP, clmc2:GFP) transgene is also indicated (#3). No TH-labeling is observed in the ectopically GFP-labeled structures. Cell nuclei were labeled with TOTO-3-Iodide to reveal anatomical landmarks (A,B). (A). Dorsal view MIP (scan from dorsal side, step size 1 μm, total depth of 410 μm, montage of three tiles from rostral part of the whole-mount) with emphasis on peripheral projections going to the lateral line neuromasts (marked with asterisks). PLLG marks posterior lateral line ganglion. (B) Ventral view MIP (scan from ventral side, step size 1 μm, total depth of 390 μm), montage of three scanned tiles from rostral part of a whole-mount larva. The ventral scan reveals GFP expression and TH-labeling in peripheral DA projections to the ventrally located lateral line neuromasts (asterisks) and otic epithelium (OE). In addition, the carotid body (CB) CA cells, the SG with their projections, and putative noradrenergic innervation of the atrial region of the heart (X1) are labeled. (C) Dorsal view of MIP from optical slices of medial subregion of the whole-mount (montage of two tiles, slices 180–240 of total 507 μm, step size: 1 μm) revealing labeled cell bodies in the depth of the brain. TH immuno-reactive cells are visible in the OB, PR and PO, among those individual cells also express GFP. A subset of TH-immunoreactive AC and their projections express GFP. In the ventral diencephalon, the DA cell clusters in the PT and dorsal hypothalamus are labeled. Double-labeled cell bodies can be observed in the anterior part of the PT in rostral (PTar) and caudal (PTac) sub-clusters, further in the cluster of the posterior PT (PTp) and in the posterior tuberal nucleus (PTN). In the dorsal medial hypothalamus small liquor contacting cells (Hdm) are labeled with GFP as well as in the caudal hypothalamus (Hc). Double labeling can also be observed in the SG. (D) Schematic representation of DA cell clusters in the PT and hypothalamus. The cells belonging to the different cell clusters can be identified and distinguished by their location, size, and shape. All scale bars: 100 μm. |
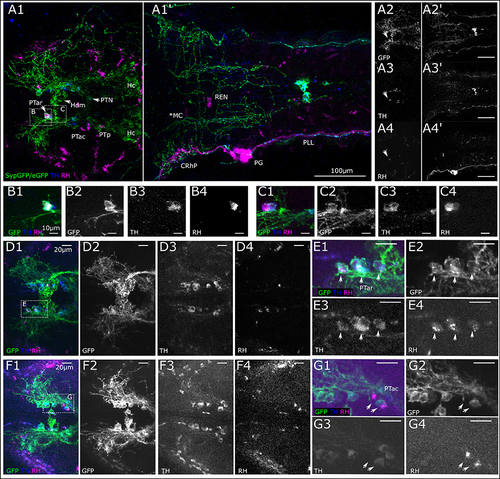
Retrograde labeling of PLL nerve marks DA neurons in the posterior tuberculum. (A) Dorsal view montages from two tiles (A1,A1') of MIPs from different substacks of larval head (total depth of 313 μm, step size 1 μm). (A1) MIP (slices 185–240) posterior tuberculum (PT) and hypothalamus (H), revealing triple stained cell efferent to the lateral line in the anterior rostral PT (PTar cluster, marked with arrow). Further DA cell clusters: anterior caudal PT (PTac), medial dorsal H (Hdm), posterior PT (PTp), posterior tuberal nucleus (PTN) and caudal H (Hc). SypGFP/eGFP-CAAX driven by th:Gal4-VP16: green, TH immunoreactivity: blue. (A1') MIP (slices 80–150) showing backfill of lateral line neurons. Rhodamine dextran (magenta) was injected into the posterior lateral line nerve (PLL); afferent neurons are labeled along the nerve, in the posterior lateral line ganglion (PG) and central rhombencephalic projection (CRhP). Efferent neurons are labeled rhombencephalic efferent neurons (REN), asterisk marks lateral dendrite of the Mauthner cell (MC), which has also faintly taken up dye. SypGFP/eGFP-CAAX expression (A2,A2'). TH-immunoreactivity (A3,A3'). Retrograde Rhodamine dextran labeling (A4,A4'). All scale bars: 100 μm. (B). Magnification of region as indicated in (A1) with Rhodamine dextran backfilled, TH and GFP immunoreactive DA PTar cell. MIP of substack (total depth of 16 μm). (C). Substack from MIP of region indicated in (A1), ventrally of (B) (total depth 16 μm) revealing two more rhodamine labeled cells in the PTar cluster. Scale bars (B,C): 10 μm. (D). Dorsal view of MIP of DA-cell clusters in PT with three Rhodamine dextran backfilled, TH and GFP immunoreactive DA cells (step size: 1 μm, total depth of 35 μm). (E). Magnification of region indicated in (D1). MIP of PTar cell bodies (total depth of 17 μm). (F). Dorsal view (MIP) of DA-cell clusters in PT with two Rhodamine dextran backfilled, TH and GFP immunoreactive DA PTac cells (step size: 1 μm, total depth of 35 μm). (G). Magnification of region indicated in (F1). MIP of PTac cell bodies (total depth of 13 μm). Scale bars (D–G): 20 μm. Pseudo coloring and sub-panels in (B–G) as described in (A), all panels labeled GFP show expression of SypGFP/eGFP-CAAX detected by anti GFP immunofluorescence. Step size for all: 1 μm. |
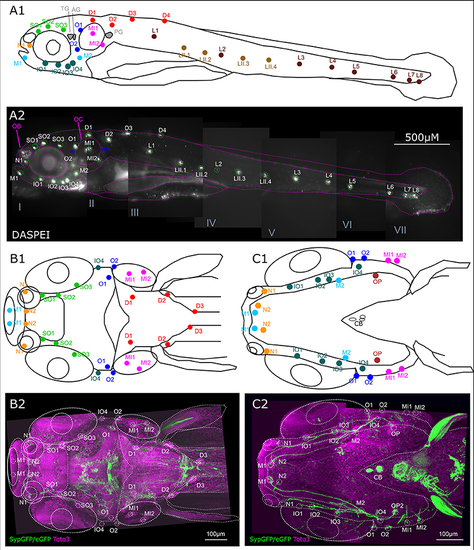
Overview of lateral line system. (A) Lateral view of 6 dpf larva with neuromasts of anterior and posterior lateral line system. Schematic drawing of neuromasts viewed from lateral. (A1) Approximate location of trigeminal ganglion (TG), anterior (AG) and posterior lateral line ganglion (PG): gray. Colors and abbreviations of head neuromasts described below (B,C), lateral branch of posterior lateral line (maroon): L1–L8, secondary lateral branch (light brown): LII.1–LII4. (A2) Lateral view of montage of seven optical stacks taken with fluorescence microscope of live 6 dpf larva stained with DASPEI in vivo to visualize neuromasts. Schematic as shown in (A1) overlaid in magenta, neuromasts marked in green. Location of trigeminal and lateral line ganglia marked with blue asterisks. Landmark structures labeled: olfactory bulb (OB) also slightly stained, otic capsule (OC). Depth of stacks: I: 62 μm, II: 250 μm, III: 82 μm, IV: 134 μm, V: 160 μm, VI: 110 μm, VII: 34 μm, step size: 2 μm. (B). Dorsal view of 6 dpf larval head with neuromasts of the anterior lateral line system as well as dorsal and medial branch of posterior lateral line system. (B1) Schematic drawing of anterior and dorsal lateral line neuromasts relative to anatomical landmarks. Dorsal branch (red) D1–D3 and medial branch (magenta) MI1 and MI2, all with cell bodies of their afferent neurons in the posterior/medial-posterior lateral line ganglion. Otic branch (blue) O1 and O2; Infraorbital branch (dark green) IO4; supraorbital branch (light green) SO1–SO3; nasal branch (orange) N1 and N2; and mandibular branch (cyan) M1, all with cell bodies of their afferent neurons in the anterior lateral line ganglion. (B2) Dorsal view of Z-MIP of montage of two tiles of rostral part of a whole mount of entire larva (total depth: 477 μm, step size: 1 μm) with overlaid schematic as shown in (B1) eGFP-CAAX/SypGFP expression driven by th:Gal4-VP16 visualized by immunofluorescence in green, TOTO-3 labeling of cell nuclei in magenta. (C) Ventral view of 6 dpf larval head with neuromasts of the anterior and otic lateral line. (C1) Schematic drawing relative to anatomical landmarks. MI1–MI2 (magenta), O1–O2 (dark blue), with cell bodies of innervating afferents in the posterior/medial-posterior lateral line ganglion. Opercular neuromast (dark red): OP, infraorbital branch (dark green): IO1–IO4, N1–N2 (orange), mandibular branch (cyan): M1–M2, with cell bodies of innervating afferents in the anterior lateral line ganglion. (C2) Ventral view of Z-MIP of montage of two tiles of rostral part of a whole mount of entire larva (total depth: 434 μm, step size: 1 μm) with overlaid schematic as shown in (C1). Pseudo colors as in (B). |
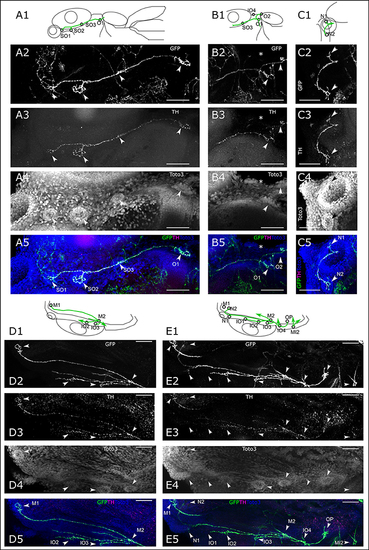
Dopaminergic innervation of the anterior lateral line neuromasts. (A–E) Panels 1: schematic showing location of projections (green) and neuromasts (circles) relative to anatomical landmarks. Panels 2 and 5 (green): th:Gal4 driven eGFP-CAAX and SypGFP (GFP) expression visualized by immunofluorescence. Panels 3 and 5 (magenta): anti-TH immunofluorescene. Panels 4 and 5 (blue): TOTO-3 labeling of cell nuclei. MIP of confocal stacks, step size (A–E) 1 μm, scale bars: 50 μm. (A). Dorsal view of right half of larval head (total depth of 135 μm) containing neuromasts (NM) of the otic (O) and supraorbital branch (SO). Arrowheads point to NM SO1–SO3 and O1. (B). Right lateral part of head, dorsal view of DA projections to NM SO3 and O1 and O2. Also visible, ventrally located NM IO4 (asterisk). Total depth of 122 μm. (C). Right frontal part of head, dorsal view of DA projection to nasal NM (N), total depth of 122 μm. (D). Right lateral part of head ventral view of DA projection to NM of the infraorbital branch (IO2 and IO3) and mandibular NM (M), total depth of 91 μm. (E). Right lateral part of head ventral view of DA projection to NM of the infraorbital branch (IO), mandibular (M), nasal (N), and opercular branch (OP). Also visible, the medial NM MI2. Total depth of 226 μm. |
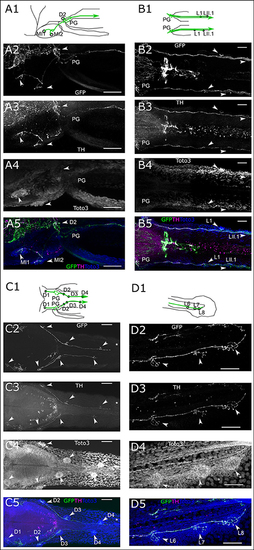
Dopaminergic innervation of the posterior lateral line neuromasts. (A–D) Panels 1: schematic showing location of projections (green) and neuromasts (circles) relative to anatomical landmarks. Panels 2 and 5 (green): th:Gal4 driven eGFP-CAAX and SypGFP (GFP) expression visualized by immunofluorescene. Panels 3 and 5 (magenta): anti-TH immunofluorescene. Panels 4 and 5 (blue): TOTO-3 labeling of cell nuclei. MIP of confocal stacks, step size (A–D) 1 μm, scale bars: 50 μm. Arrowheads point at neuromasts. (A). Left lateral part of head dorsal view of DA projections to NM of the medial branch (MI) and dorsal NM D2, as well as projection going through the posterior lateral line ganglion (PG) and toward the posterior lateral line nerve. Total depth of 175 μm. (B). Dorsal view of DA projection to NM L1 and LII.1. Total depth of 130 μm. (C). Dorsal view of DA projection to neuromasts of the dorsal branch (D) of the posterior lateral line. Asterisk indicates putatively developing neuromast without innervation by GFP labeled fibers. Total depth of 60 μm. (D). Lateral view of DA projection to tail NM of the lateral branch (L) of the posterior lateral line. Total depth of 25 μm. |
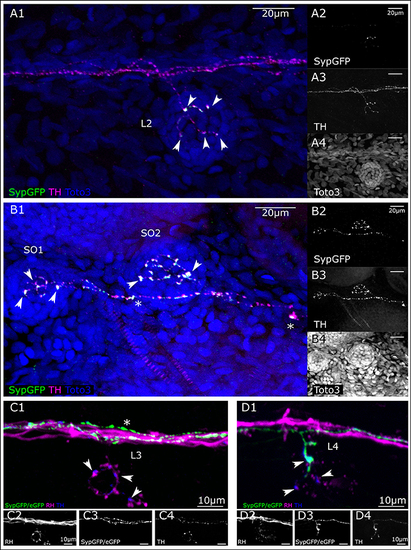
Putative pre-synaptic structures in dopaminergic fibers innervating lateral line neuromasts. (A) Lateral view (MIP) of L2 NM immunofluorescence labeled in transgenic th:Gal4, UAS:SypGFP 6 dpf larva to highlight synaptic structures. (A1) Merged image of channels shown in (A2–A4). Total depth of 47 μm. SypGFP green and in (A2), anti-TH magenta and in (A3), TOTO-3 blue and in (A4). Arrowheads point to putative synaptic structures. (B) Dorsal view (MIP) of SO1 and SO2 NM in the anterior lateral line, immunofluorescence labeled in transgenic th:Gal4, UAS:SypGFP 6 dpf larva. (B1) Merged image of channels shown in (B2–B4) Total depth of 59 μm. SypGFP green and in (B2), anti-TH magenta and in (B3), TOTO-3 blue and in (B4). Arrowheads point to putative synaptic structures. Asterisks: Putative axonal transport vesicles containing synaptophysin. (C) Lateral view (MIP) of L3 NM, immunofluorescence labeled in transgenic th:Gal4, UAS:SypGFP, UAS:EGFP-CAAX larva, with retrograde fill from lateral line nerve with rhodamine dextran (RH) dye to trace the afferent neurons. (C1) Merged image of channels shown in (C2–C4). Afferent neurons labeled with rhodamine dextran shown in magenta and in (C2), SypGFP/EGFP-CAAX green and in (C3), anti-TH blue and in (C4), total depth of: 34 μm. Arrow heads point to putative synapses between the afferent neuron (magenta) and the efferent DA projection (blue, anti-TH immunoreactivity). Asterisk indicates axon of DA projection passing by the L3 neuromast. (D) Lateral view of L4 NM (MIP, same fish as in C). (D1) Merged image of channels shown in (D2–D4), total depth of 37 μm. Arrowheads point to putative synapses between the afferent neurons (magenta) and the efferent DA projection labeled with GFP (green, and D3) and anti-TH (blue, and D4). The projection labeled by the expressed GFP enters NM L4. Step size for (A–D) 1 μm. Scale bars (A,B) 20 μm, (C,D) 10 μm. |
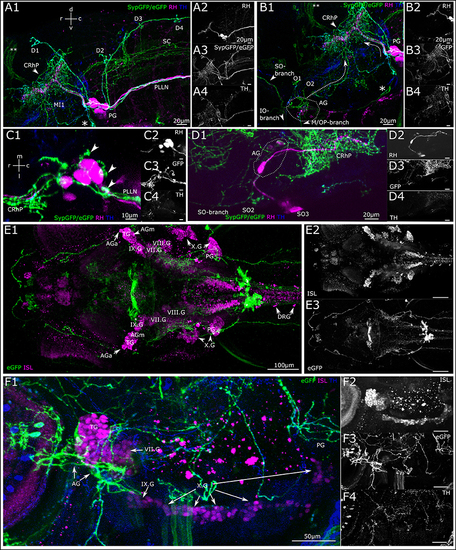
Dopaminergic projections to lateral line ganglia and other cranial ganglia. (A) Lateral view (MIP) of the region around the posterior lateral line ganglion (PG). Step size: 1 μm, total depth of: 81 μm. Primary afferent lateral line neurons retrogradely labeled with rhodamine dextran (A2, magenta in A1) by dye injection into the posterior lateral line nerve (PLLN) at a neuromast. A number of afferent neurons took up dye, which have cell bodies residing in the PG and project centrally into the rhombencephalon (CRhP, arrowhead). SypGFP/eGFP-CAAX labeling driven by th:Gal4-VP16 (A3, green in A1). DA-axons project through the PG and along the PLLN as well as to the dorsal (D) and otic (O) neuromasts. Ventrally, the projection branches toward the vagus ganglia (asterisk). Dorsally, the DA-projection runs parallel with the CRhP of the afferent neurons. Central DA-projections are present in the spinal cord (SC). Double asterisks: ectopically labeled commissure. TH-immunoreactivity of efferent DA-projections (A4, blue in A1). (B) Lateral view (MIP) of region around the anterior lateral line ganglion (AG), step size: 1 μm, total depth: 81 μm. Rhodamine was injected into the PLLN labeling afferent neurons of the posterior lateral line (B2, magenta in B1), but not of the anterior lateral line. DA-axons projecting through the AG labeled with th:Gal4-VP16 driven SypGFP/eGFP-CAAX (B3, green in B1), and projecting rostrally parallel to the infraorbital (IO) and supraorbital (SO) branch, as well as caudally (dotted arrow) toward the CRhP (arrow head) and ventrally to the mandibular (M) and opercular (OP) neuromasts. Asterisk marks the branch of the DA projection coming from the PG and running along the region of the vagus ganglia. Double asterisk: ectopically labeled commissure. TH-immunoreactivity labeling DA projections (B4, blue in B1). Orientation for A, B indicated in (A1). (C) Dorsal view (MIP) of PG. Pseudo-colors and channels as in (B). Step size: 1 μm, total depth: 59 μm. DA projections running through the PG. Arrowheads in C1 pointing to DA fibers projecting dorsally along the lateral line nerve branches toward the dorsal neuromasts. Rostrally, DA-projections run parallel with afferent neurons to CRhP. (D) Dorsal view (MIP) of region around AG. Rhodamine dextran (magenta in D1) was injected into the MI1/MI2 branch of the anterior lateral line and labels few afferent anterior lateral line neurons, which centrally project into the hindbrain, with efferent DA projection arborizing around the CRhP (green in D1). Step size: 1 μm, total depth: 155 μm. Orientation for (C,D), indicated in (C1). (E). Dorsal view (MIP) of whole mount, montage of two stitched tiles with larval head. Step size: 1 μm, total depth: 476 μm. Cell bodies of sensory afferent neurons are labeled with primary anti-Islet1/Islet2 (ISL), and secondary Alexa555 antibodies (E2, magenta in E1) in the cranial and dorsal root ganglia (AGa, anterior part of anterior lateral line ganglion; AGm, medial part of AG; TG, trigeminal ganglion; PG, posterior lateral line ganglion; DRG, dorsal root ganglia; VII.G, facial ganglion; VIII.G, statoacoustic ganglion; IX.G, glossopharyngeal ganglion; X.G, vagus ganglia). Th:Gal4 driven eGFP-CAAX labeling of DA-projections (E3). (F) Lateral view (MIP) of region with AG and PG. (step size, 3.63 μm, depth 137.9 μm). Pseudo coloring and channels as in (E). TH-immunoreactivity, (F4) and blue in (F1). DA projection contacting the AG and TG, and further projecting to the vagal ganglia. |
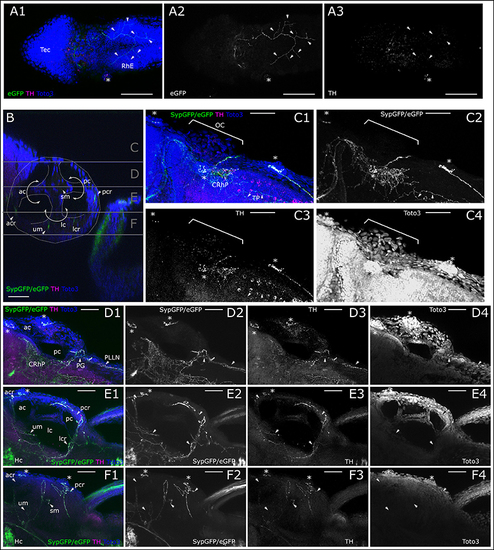
Dopaminergic innervation of trigeminal nerve endings and inner ear epithelium. (A) MIP of dorsal part of larval head (Slices 16–40 of 507 μm stack, step size: 1 μm) with the tectum (Tec) and rhombencephalon (RhE) showing potential CA arborizations, which could represent parallel innervation of trigeminal free nerve endings in the skin. Asterisk marks supraorbital neuromast. Arrowheads point to branches of the skin innervation labeled with th:Gal4 driven eGFP-CAAX (TOTO-3: A2 and blue in A1) and faint TH-immunoreactivity (A3, magenta in A1). (B) Sagittal section from XZ-orthoslice at 173 μm of z-stack (dorsal scan, step size: 1 μm, total depth: 462 μm, total width 509 μm) showing the developing inner ear outlined in white with the developing canals of the labyrinth, divided by epithelial pillars (white solid arrows) and relative location of the sensory epithelia with DA innervation (ac, anterior canal; acr, anterior crista; lc, lateral canal; lcr, lateral crista; pc, posterior canal; pcr, posterior crista; sm, saccular macula; um, utricular macula; Whitfield et al., 2002). Gray horizontal lines indicate sections of Z-MIP shown in (C–F). (C). Z-MIP of otic slice stack “C” indicated in (B) (slice 1–125 of 462, step size: 1 μm) with otic capsule (OC). Asterisks mark lateral line neuromasts. On the skin surface potential parallel DA innervation of trigeminal projections (TP) are labeled. Parallel innervation of central lateral line projection in the rhombencephalon is also labeled (CRhP). In the hindbrain most catecholaminergic cell bodies show TH-immunoreactivity but no GFP expression. (D) Z-MIP of otic slice stack “D” indicated in (B) (slice 125–185), showing ac and pc, also posterior to otic capsule the posterior lateral line ganglion (PG) and posterior lateral line nerve (PLLN) with parallel DA innervation (arrowheads). Asterisk marks one of the medial neuromasts on the surface of the OC. (E) Otic slice stack “E” indicated in (B) (slice 185–245) with innervation of sensory epithelia (arrowheads). (F) Otic slice stack “F” as indicated in (B) (slice 245–300) with sensory epithelia of maculae and innervation (arrowheads). In (A–F) asterisks mark neuromasts of the lateral line. Scale bars (A) 100 μm, (B–F) 50 μm. eGFP-CAAX-/SypGFP-expression driven by th:Gal4-VP16: green and panels 2; anti-TH: magenta and panels 3; TOTO-3: blue and panels 4. |
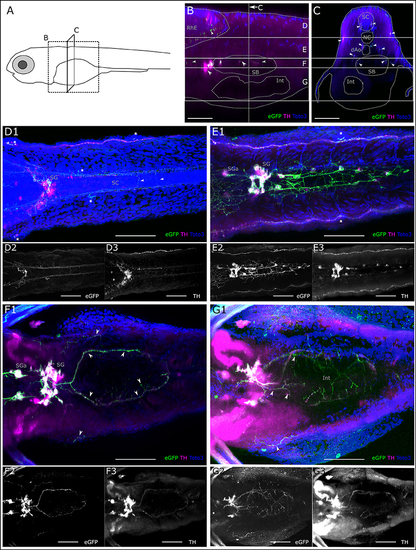
Catecholaminergic innervation of the intestine. (A) Schematic of 6dpf zebrafish larva with scanned sections as depicted in (B,C). (B) Sagittal section from XZ-orthoslice at 243 μm of z-stack (dorsal scan, step size: 1 μm, total depth: 507 μm, total width: 509 μm) of larval region including the gut. Dotted gray lines outline anatomical landmark structures rhombencephalon (RhE), swim bladder (SB) and intestine (Int). Dashed white vertical line indicates region of transverse section shown in C. Solid white horizontal lines indicate borders of regions used for Z-MIPs shown in (D–G). White arrowheads point to catecholaminergic structures in the RhE (region D), and in and around the SB, cell bodies anteriorly of the SB represent sympathetic ganglia (SG) and their projections (region F). (C) Transverse section from YZ-orthoslice at 246 μm of same z-stack. Outlined structures: spinal cord (SC), notochord (NC), dorsal Aorta (dAo), SB and Int. Arrowheads point to catecholaminergic projection tracts in SC (region D), and projections on lateral line nerve (regions (D,E)), around dAo (region E), and SB (region F). (D) Z-MIP from dorsal subregion as indicated in (B,C) (slice 1–140). Arrowheads point to catecholaminergic commissures of descending central projections in the SC. Asterisks mark neuromasts of the lateral line. Cell bodies are visible in the sympathetic ganglia (SG), of which only a subset is marked with GFP. (E) Z-MIP from middle substack (slice 140–225) containing catecholaminergic cell bodies in anterior SG (SGa) and in the more posteriorly located SG of the superior cervical ganglion complex, as well as dispersed caudal trunk sympathetic neurons, which project between NC and dAo. (F) Z-MIP of ventral substack (225–265) including cell bodies of SGa and SG, arrowheads point to ring-shaped innervation around SB and projections peripheral to SB. (G) Z-MIP of ventral-most substack (225–400) containing a ventral part of the gut. Arrowheads point to sparse catecholaminergic projections above and around the intestine. All scale bars (B–G): 50 μm; GFP-expression driven by th:Gal4: green and panels 2; anti-TH: magenta and panels 3; TOTO-3: blue. |
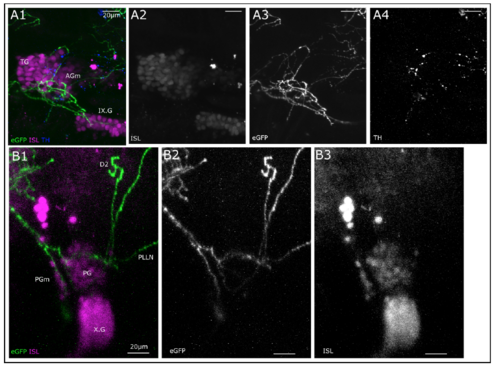
Dopaminergic innervation of lateral line ganglia. A. Lateral view, MIP (total depth of 54.19 μm, step size: 1.18 μm), of region of medial anterior lateral line ganglion (mAG) with trigeminal ganglion (TG) and glossopharyngeal ganglion (IX.G). GFP expression driven by th:Gal4-VP16 (green, A3) in projections targeting the trigeminal and lateral line ganglion and also running through IX.G. Cell bodies of sensory afferent neurons in ganglia marked with Islet1/Islet2 immunoreactivity (ISL, magenta, A2). TH-immunoreactivity shown in blue and A4. B. Lateral view, MIP (total depth of 40.95 μm, step size 1.17 μm), of region of posterior lateral line ganglion, which can be further subdivided into medial posterior lateral line ganglion (PGm) and posterior lateral line ganglion (PG). Also visible: caudal vagus ganglion (X.G). Neurons with GFP expression (green and B2) target PGm and PG and project to dorsal neuromast, along central projection of lateral line afferent neurons and posterior lateral line nerve (PLLN). Sensory afferent neurons marked with ISL-immunoreactivity (magenta and B3). All scale bars: 20μm. |
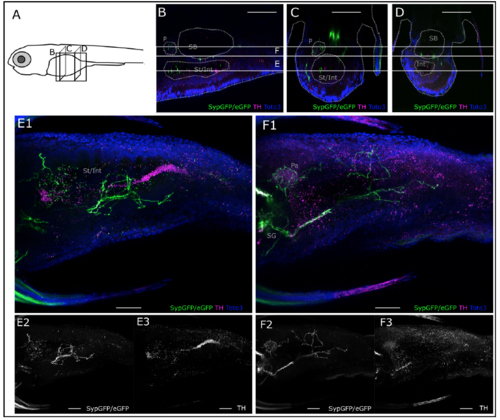
Catecholaminergic innervation of the abdomen, ventral scan. A. Schematic of 6dpf zebrafish larva with scanned sections as depicted in B-D. B. Sagittal section from XZ-orthoslice at 272 μm of z-stack (ventral scan, step size: 1μm, total depth: 390 μm, total width: 509 μm) of larval region including the gut. Dotted grey lines outline anatomical landmark structures, probably the pancreas (P) swim bladder (SB) and stomach and intestine (St/Int). Solid white horizontal lines indicate borders of regions used for MIPs shown in E and F. C. Transverse section from YZ-orthoslice at 100μm of same z-stack. Outlined structures: P and St/Int. D. Transverse section from YZ-orthoslice at 381μm of same z-stack. Outlined structures: SB and Int. E. MIP from subregion as indicated in B-D (slices 170-230). Catecholaminergic projections between and around the SB and the Int/St are labeled with GFP driven by th:Gal4-VP16 and are faintly THimmuno- reactive. F. MIP from subregion as indicated in B-D (slices 230-270). Catecholaminergic projection around the SB is labeled with GFP and anti-TH. Round structure rostral to SB shows strong GFP and anti-TH labeled innervation, probably representing innervation of the pancreas (P) by sympathetic projections. All scale bars: 50μm. GFP: green, panels 2, anti-TH: magenta, panels 3, TOTO-3: blue. |