
- Title
-
Brain activity patterns in high-throughput electrophysiology screen predict both drug efficacies and side effects
- Authors
- Eimon, P.M., Ghannad-Rezaie, M., De Rienzo, G., Allalou, A., Wu, Y., Gao, M., Roy, A., Skolnick, J., Yanik, M.F.
- Source
- Full text @ Nat. Commun.
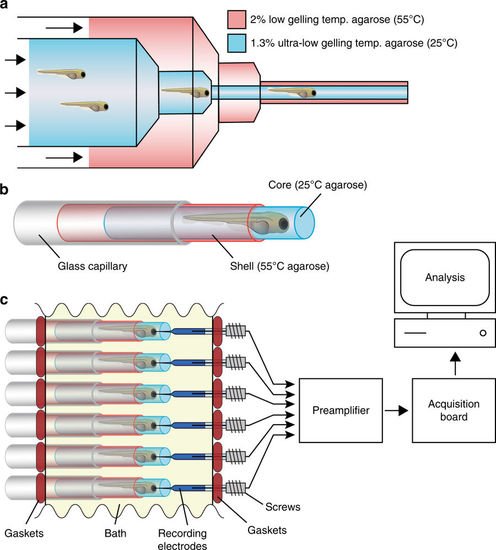
High-throughput local field potential (LFP) recording platform. a Zebrafish larvae are transferred to liquid 1.3% ultra-low gelling temperature agarose (25 °C) and placed inside a 20 mL syringe. The 20 mL syringe is then inserted into a 60 mL syringe filled with 2% low gelling temperature agarose (55 °C). Syringes are capped with concentric 18-gauge and 16-gauge needles, respectively, allowing both agarose solutions to be simultaneously extruded into a room temperature bath where they rapidly gel. Up to 50 larvae can be embedded in a single extrusion. b Diagram of a zebrafish larvae embedded in an ultra-low gelling temperature agarose core surrounded by a rigid agarose shell. Embedded larvae are loaded into glass capillaries prior to LFP recording. c Schematic representation of the high-throughput LFP recording platform. Embedded larvae in glass capillaries are inserted into the platform in parallel directly opposite an array of glass recording electrodes. The water-tight recording chamber bath is filled with zebrafish embryo medium and the recording electrodes are advanced into the larvae using miniaturized screws. Up to 16 larvae can be recorded simultaneously using a 16-channel preamplifier connected to a low-power digital acquisition chip |
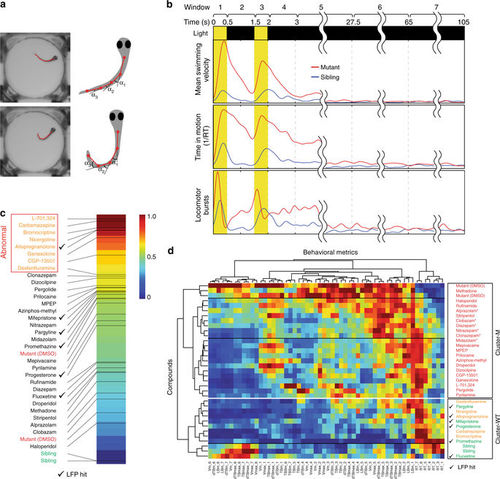
Deep behavioral phenotyping. a Automated image processing algorithms are used to locate the head and multiple points along the midline axis of the tail for each larva. Behavioral metrics are calculated based on these landmarks. b Seven temporal windows are defined relative to the onset of the seizure-inducing light stimulus: (1) first light pulse (0–0.5 s), (2) inter-pulse interval (0.5–1.5 s), (3) second light pulse (1.5–2 s), (4) early post-pulse 1 (2–3 s), (5) early post-pulse 2 (3–27.5 s), (6) early interictal (27.5–65 s), and (7) late interictal (65–105 s). Eight behavioral metrics are calculated using 40+ data points (n = 10+ larvae, each subjected to four independent light stimuli) per metric over all seven temporal intervals. Representative examples are shown for mean swimming velocity (Vm), locomotor bursts (Burstm), and time spent in motion (RT) in untreated (1% DMSO) scn1lab mutants (red) and sibling controls (blue). c Behavioral fingerprints ranked based on Euclidean distance from sibling controls (green) during interictal periods (temporal windows 6 and 7). Compounds in the upper quartile (furthest from siblings) are presumed to have adverse side-effects on resting state behavior and are designated abnormal (orange text). Mutants are indicated in red text; hits based on LFP analysis are indicated by check marks. d A 56-component behavioral fingerprints are generated for each compound based on all eight behavioral metrics during all seven temporal windows. Each square represents the average value for that feature. Compounds and behavioral fingerprints are analyzed by hierarchical clustering to identify groups that produce similar behavioral outcomes. Cluster-M contains compounds with behavioral profiles similar to untreated mutants (red text) and Cluster-WT contains compounds with profiles similar to wild-type sibling controls (green text). Compounds in Cluster-WT that cause substantial alterations in resting state behavior (temporal windows 6 and 7) are indicated in orange text. Benzodiazepines are indicated with asterisk (*), hits based on LFP analysis are indicated by check marks PHENOTYPE:
|
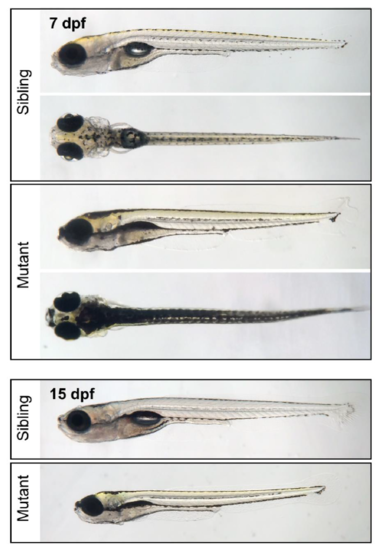
Visible phenotypes in the scn1labsa16474 line. (Top) Lateral and dorsal views of an sa16474 homozygous mutant and an age-matched sibling control larva at 7 dpf. Mutant larvae exhibit dark coloration due to dispersed melanosomes and fail to inflate their swim bladders. (Bottom) Lateral view of an sa16474 homozygous mutant and an age-matched sibling control larva shown at the same magnification at 15 dpf. Mutants fail to thrive and show elevated levels of mortality beginning in the second week of development (survival of mutants at 14 dpf=32%, n=28; survival of siblings at 14 dpf=95%, n=39). PHENOTYPE:
|
