
- Title
-
Optimal occlusion uniformly partitions red blood cells fluxes within a microvascular network
- Authors
- Chang, S.S., Tu, S., Baek, K.I., Pietersen, A., Liu, Y.H., Savage, V.M., Hwang, S.L., Hsiai, T.K., Roper, M.
- Source
- Full text @ PLoS Comput. Biol.
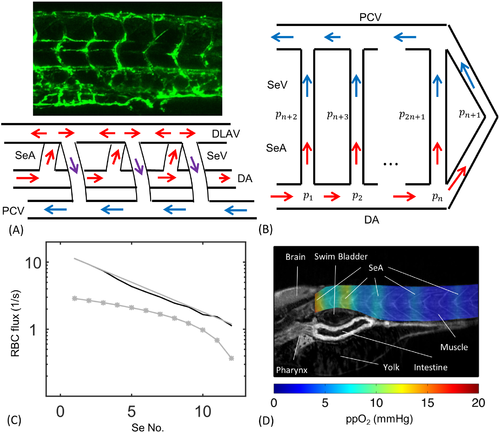
The embryonic zebrafish trunk is perfused by a series of parallel intersegmental arteries (SeAs). Hydraulic models for the network predict that the first of these SeA will short circuit flow through the trunk. (A) 4 day post-fertilization zebrafish embryo trunk network and wiring diagram showing PCV, DA and Se vessels in which SeA connect directly to SeV. (B) Representation of the same network as a set of hydraulic resistors. (C) A resistor network model predicts that cell fluxes decrease exponentially with distance from the heart (Black curve: numerical solution using real geometric parameters, Gray line: asymptotic model. For these two curves flow rates are multiplied by the concentration of red blood cell ρ = 0.003 μm−3 measured in [43]). By contrast an occlusive feedback model incorporating uniform occlusion strength αc = 1.01 × 10⁻⁶ g/μm4 s did not lead to more uniform distribution of red blood cell fluxes between vessels (Gray stars). (D) Anisotropic fluxes produce uneven oxygen perfusion within the trunk. Simulation results are superimposed on a zebrafish CT image reproduced from [53]. |