
- Title
-
Small molecule screen in embryonic zebrafish using modular variations to target segmentation
- Authors
- Richter, S., Schulze, U., Tomançak, P., Oates, A.C.
- Source
- Full text @ Nat. Commun.

Screening strategy and phenotypic scoring. a Schematic overview of the screening set up. b Criteria for phenotypic scoring based on morphological (E, H, Y, D, A, T) and segmentation parameters (S, BD, AD, TD, PD, BS). Each are rated from 0 to 3 (normal to strong difference) compared to untreated controls. All parameters together generate a phenotypic vector for each treatment. c Wild type control embryo at 36 hpf, after xirp2a in situ hybridization, illustrating the different scoring parameters evaluated on fixed embryos at the stage of 36 h post fertilization (hpf). Segmentation parameters (S, BD, AD, TD, PD, BS) evaluated the quality of formed segments at different axial localization (AD, BD, TD) and overall segment boundary quality (BD), shape (BS) or dorsal-ventral segment defects (S) based on xirp2a mRNA expression. The phenotypic vector displayed below the image reflects a normally developed embryo. d Numerical parameter score converted into a color scale bar. e Representative phenotypes of positive controls: 50 µM DAPT shows posterior myotome boundary defects (bracket and inset) without altering embryonic development otherwise; 10 µM SU5402 affected embryonic development, with a reduction in antero-posterior axis and yolk extension, together with posterior myotome boundary defects (bracket and inset). Associated fingerprints for each positive control illustrate low phenotypic variation in different experiments. Scale bar: 200 µm |

Phenotypic hit selection. a Number of direct segmentation phenotypes in each experiment identified as hits. The same small molecules may count multiple times, if phenotypes were observed in more than one treatment. b Dendrogram from hierarchical cluster analysis of phenotypic vectors. Colored boxes highlight clusters presented in c, e, g; high-resolution dendrogram in Supplementary Fig. 1. Correlation values above plot. c Direct segmentation phenotypes identified as “1st class phenotypes”, obtained from five different small molecules. d 10 µM SB225002 in wild type embryos caused specific mid-trunk defects of myotome boundaries (brackets, inset) with normal embryo morphology. e Direct segmentation phenotypes identified as “secondary tail appendage”. f 50 µM Wee1 Inhibitor in wild type embryos showing relatively normal morphology, but posterior segmentation defects (brackets, inset) with a small secondary tail appendage (arrow, dotted line). g, h Molecules were selected from cluster with segmentation defects and strong morphological defects. Temporally-controlled pulse in wild type embryos increased segmentation-specificity. g Standard long-term small molecule treatment with 50 µM estradiol caused strong developmental defects with rudimentary head and axis in wild type embryos (arrowheads). h Pulse experiments of 50 µM estradiol from 10 hpf for four hours showed recovered head and axis structures (arrowheads) and specific myotome boundary disruptions of up to 13 segments (bracket). Inset shows disrupted boundaries. Wild type embryos at 36 hpf, in situ hybridization for xirp2a. Scale bar: 200 µm |

Concentration dependence of phenotype. a Plot showing the number of lethal treatments, treatments showing at least one defect (any parameter > 0), or no defects depending on the concentration as a mean ( ± SD) of four independent experiments (2 wild type replicates, 2 mutant genotypes). Lethal conditions significantly increased with increasing concentration (2-way ANOVA, P < 0.0001). b Wild type_A phenotypic scores across the concentration series illustrated as interaction networks. Inner circles represent phenotypic parameters: morphology in green, segmentation in red. Size of nodes represents the frequency of scoring > 0 for each individual parameter. Interactions to outer circle represent the link of phenotypic parameter to given small molecule (gray circles). Thickness of interaction lines gives magnitude of score. Dark gray circles, lethal treatments. Small molecule names corresponding to numbers can be found in Supplementary Table 1. Small molecule highlighted in outer circle across concentration series is 17-AAG. Representative images shown in c–e. c 2 µM 17-AAG, normal segmentation (inset), mild defects of head (arrowheads) and yolk extension. d 10 µM, defects of the head morphology (arrowhead) and thickened yolk extension (arrowheads), truncated axis and disrupted myotome boundaries posterior to the 8th (bracket). e 50 µM, 17-AAG, strong developmental defects (arrowheads) and disrupted segmentation (bracket, inset). Corresponding phenotypic vector fingerprints below each image show increasing scores for almost all parameters with increasing concentration. Scale bar: 200 µm |

Mutant background changed sensitivity to small molecule perturbation. Wild type, her1 and hes6 mutant embryos at 36 hpf after small molecule treatment as indicated, xirp2a expression in myotome boundaries shown for segments 5–15. a–d Myotome boundaries of each genotype normal in 0.5% DMSO control. 10 µM IPA-3 normal segmentation in wild type replicates e, f and in the hes6 mutant h. g 10 µM IPA-3 in her1 mutants, severe myotome boundary disruptions in trunk. i, j 10 µM SB225002 in wild type, mild myotome boundary defects of boundaries 4–10 (arrowheads). k 10 µM SB225002 in her1 mutant, severe boundary disruptions, defects extended posteriorly along axis. l 10 µM SB225002 in hes6 mutant, no effect on myotome boundary. Embryos had otherwise normal morphology, as indicated by phenotypic vector fingerprints. Scale bar: 100 µm |
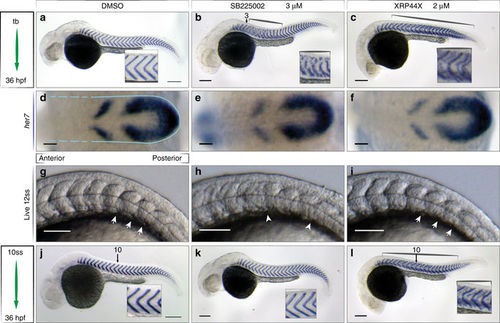
Small molecules perturb segmentation at distinct steps. Wild type embryos after in situ hybridization for xirp2a mRNA at 36 hpf to mark myotome boundaries a–c, j–l, her7 mRNA at 10 ss to show segmentation clock expression d–f, and live at 12 ss to show somite boundaries, N = 3 g–i, treatments as indicated. a 0.5% DMSO-treated control embryos. b 3 µM SB225002 treatment from tailbud (tb), myotome boundary defects of the mid-trunk, segments 3–15 (brackets, inset). c 2 µM XRP44X, segment defects along axis (brackets), ectopic staining of xirp2a within myotomes (inset). d-f Cyclic her7 mRNA normal in all treatments. Blue outline indicates PSM, broken lines indicate area of formed somites, (n = 45, 3 of 3 experiments). g 0.5% DMSO and i 2 µM XRP44X showed normal somite formation with intact formed somite boundaries (arrows). h 3 µM SB225002, no clear somite boundaries posterior to somite 5 (arrowheads). Last somite boundary not detectable (n = 30, 2 of 3 experiments). j–l Treatments starting from 10 ss as indicated. j Normal segmentation in control. k 3 µM SB225002 no effect on myotome boundaries (inset) (n = 50, 5 of 7 experiments). l 2 µM XRP44X, myotome boundary defects along axis (brackets, insets), affecting segments formed prior to treatment (n = 40, 3 of 4 experiments). Scale bar for a–c, j–l = 200 µm, d–i = 50 µm |

Activity of XRP44X on microtubules during zebrafish segmentation. a, b Zebrafish blastomere cleavage at the 32 cell stage, F-actin in green (phalloidin), alpha tubulin in magenta and DNA with DAPI. a DMSO control, normal division with mitotic spindles (arrow). b XRP44X treated embryos, short microtubules, no mitotic spindle (arrowhead). Scale bar = 10 µm. c–e Embryos at 36 hpf, showing DMSO control, 2 µM XRP44X and 0.01 µM combretastatin A4 treatment. Xirp2a mRNA shows myotome boundaries with chevron pattern in DMSO (c; inset), ectopic xirp2a staining between faint and blurry boundaries with small molecule treatments (d, e; inset). f–h F-actin (phalloidin, green) in 20 ss embryos showing most recently formed boundaries (arrows). f In DMSO, thin straight boundary lines form between somites. With XRP44X g and combretastatin A4 h treatments, boundaries formed less clearly, and mature boundaries had gaps (asterisks). i–k During myogenesis, muscle fibers elongate (blue lines) to span the myotome i. With XRP44X and combretastatin A4, muscle fibers do not fully span the myotome j, k remaining partly rounded (arrowheads). l, m Myotomes of DMSO control and small molecule-treated embryos at 36 hpf. F-actin visualized with phalloidin (gray). Muscle fibers are well organized within each myotome in DMSO l, vertical myotome boundaries are highlighted as blue lines. m, n Small molecule-treated embryos showed loss of muscle fiber structure with round and short muscle fibers (arrowheads) and no clear myotome separation. XRP44X m treatment showed a higher level of disorganization than combretastatin A4 n. c–h, l–n scale bar = 50 µm, i–k scale bar = 20 µm. N = 30, 3 of 3 experiments showed representative phenotypes |
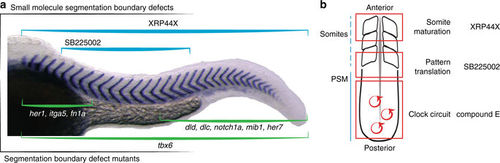
Overview of selected direct segmentation phenotypes. a Schematic of axial distributions of known mutant somite boundary defects (green brackets) and newly identified small molecule perturbation defects (blue brackets, this paper). Her1, integrin α5 [itga5] and fibronectin 1a [fn1a] anterior defects; T-box 6 [tbx6] mutants, defects along axis; mutants deltaD [dld], deltaC [dlc], notch1a, mindbomb E3 ubiquitin protein ligase 1 [mib1] and her7, posterior defects11,12,71,72,73,74. b Schematic highlighting steps of segmentation (clock circuit, pattern translation, somite maturation) in red boxes and examples of small molecules from the screen that affect the corresponding step |
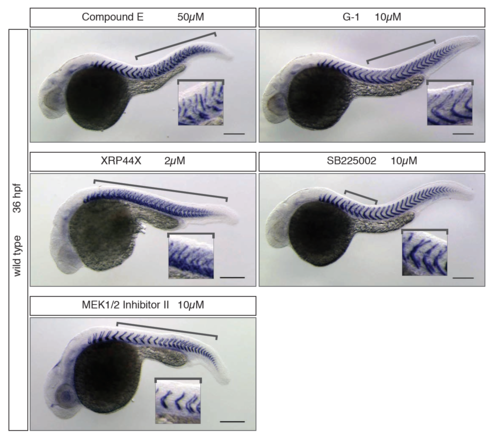
1st class segmentation phenotypes Identified hit phenotypes with direct segmentation defects according the classification used in Table 1, visible at 36 hpf after xirp2a in situ hybridization. All treatments are as labelled in the panel above the image. Anterior to the right, posterior to the left. Insets show zoom-in of the segment pattern and defects. Brackets indicate the area of the axis where segment boundary defects occurred. |

Secondary tail appendage phenotypes Identified hit phenotypes with direct segmentation defects according the classification used in Table 1, visible at 36 hpf after xirp2a in situ hybridization. All treatments are as labelled in the panel above the image. Anterior to the right, posterior to the left. Insets show zoom-in of the segment pattern and defects. Brackets indicate the area of the axis where segment boundary defects occurred. Dotted line outlines observed secondary tail appendage. |
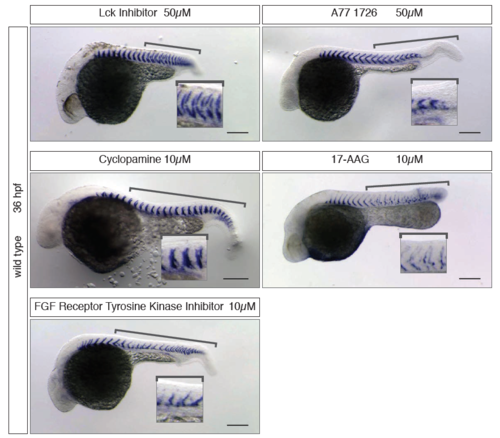
Phenotypes with lower segmentation-specificity Identified hit phenotypes with direct segmentation defects according the classification used in Table 1, visible at 36 hpf after xirp2a in situ hybridization. All treatments are as labelled in the panel above the image. Anterior to the right, posterior to the left. Insets show zoom-in of the segment pattern and defects. Brackets indicate the area of the axis where segment boundary defects occurred. |
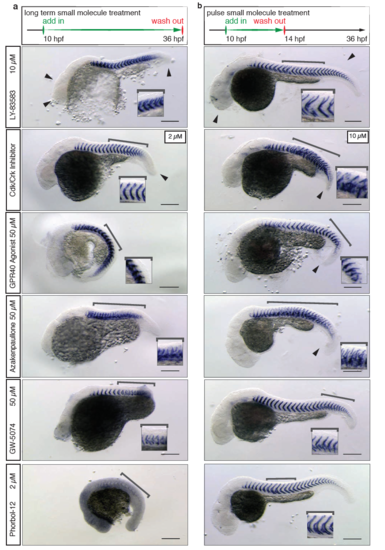
Pulse treatments with higher segmentation-specificity Hits previously hidden in the general morphology cluster that were identified after 4h pulse treatment with subsequent washout. Small molecules and concentration used are labelled in the left panel. Anterior to the right, posterior to the left of each image. (a) Embryonic phenotypes as observed after long-term treatment during screen. (b) Embryonic phenotypes showing higher segmentation-specificity after shorter pulse treatment. In the case of the Cdk/Crk inhibitor, the 10 μM long-term treatment was lethal, so the 2 μM long-term treatment is shown instead. Insets show zoom-in of the segment pattern and defects. Brackets indicate the area of the axis where segment boundary defects occurred. Scale bar is 200 μm. |

Direct segmentation phenotypes from her1 mutants Identified hit phenotypes with direct segmentation defects according the classification used in Table 1, visible at 36 hpf after xirp2a in situ hybridization, in a her1 mutant background. All treatments are as labelled in the panel above the image. Anterior to the right, posterior to the left. Insets show zoom-in of the segment pattern and defects. Brackets indicate the area of the axis where segment boundary defects occurred. |

Trunk myotomes, neurites, notochord and pronephric ducts in embryos treated with SB225002 and XRP44X Confocal images of DMSO control and small molecule treated embryos at 36 hpf. F-actin visualized with phalloidin (green), acetylated tubulin by immunostaining (magenta) and nuclei with DAPI (cyan). Scale bar is 50 μm. (a-c) Trunk section through myotomes 12 to 17. Myotomes show F-actin organized in skeletal muscle fibres of the DMSO control (d). Muscle fibres are straight and span each myotome from the anterior to the posterior vertical border, highlighted as white lines. (e) In 3 μM SB225002 treated embryos, some vertical myotome borders are discontinuous and less straight (white lines). Occasional appearance of round muscle cells and disorganized structures (arrowheads) in myotomes. (f) Thicker and shorter muscle fibres in 2 μM XRP44X treated embryos. Muscle fibre structure is disorganized; vertical myotome boundary pattern is disrupted (white lines). (g-i) Neurons of the peripheral nervous system (asterisks) and pronephric ducts (arrows) developed and extended along the axis in control and small molecule treatments. Ventral axons of primary motor neurons are bent and shorter in XRP44X treated embryos (i, arrowheads) compared to DMSO control. (j-l) Nuclei show a high density at the level of the spinal cord throughout all tested conditions. (m-o) Cells of the notochord all have vacuoles and are densely packed in control and drug-treated embryos (asterisks). (q-s) Normal extension of the pronephric ducts until the posterior end of the yolk extension towards the developing anus (arrowheads). |
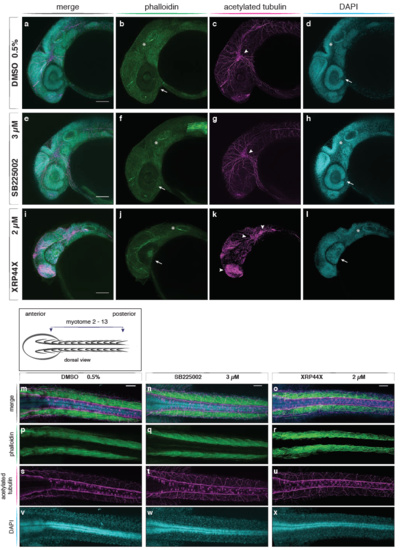
Head structures, neurites and dorsal view of trunk in SB225002 and XRP44X treated embryos Confocal images of DMSO control and small molecule treated embryos at 36 hpf. F-actin visualized with phalloidin (green), acetylated tubulin by immunostaining (magenta) and nuclei with DAPI (cyan). (a-l) Maximum projection of a stack of confocal sections of the lateral head of DMSO control and small molecule treated embryos. Scale bar is 100 μm. Control (a-d) and SB225002 (e-h) treated embryos show comparable development of main organs and tissue of the head: eyes with lens and retina (arrows), otic vesicles (asterisks) and neurons of the central nervous system (arrowheads). XRP44X treatment (i-l) led to a reduced eye size and loss of the ventral fissure (j), abnormal distribution of acetylated tubulin and accumulation in the head, developing mouth and olfactory organs (asterisks, k). (m-x) Maximum projection of a stack of confocal sections of the dorsal trunk area of DMSO control and small molecule treated embryos. Scale bar is 50 μm. Individual myotome structure is visible in DMSO and SB225002 treated embryos (p,q), but is less organised in XRP44X treatments (r) where individual myotomes are not detectable. (s-u) Neurons of the peripheral nervous system developed all along the anterior posterior axis in control embryos and all treatments. (v-x) Nuclei along the axis show a comparable distribution of cells between control and drug treatments. |