
- Title
-
Anisotropic shear stress patterns predict the orientation of convergent tissue movements in the embryonic heart
- Authors
- Boselli, F., Steed, E., Freund, J.B., Vermot, J.
- Source
- Full text @ Development

Schematic of photoconversion experiments and of the three-dimensional analysis of early AVC morphogenesis. (A) The atrium (a) and ventricle (v) of a 36 hpf fli:kaede heart are exposed to 405 nm UV light to photoconvert the genetically encoded Kaede protein from its green to red configuration. The same heart is imaged at 36 hpf and at 48 hpf to assay the movement of the photoconverted tissue. (B,C) Maximum intensity projection of a fli:kaede heart at 36 hpf and 48 hpf, respectively. (D) AVC segmentation and analysis: the endocardium of the AVC region is segmented with a parametric surface. The color intensity of the 3D dataset is projected on the parametric surface and the AVC is unfolded for 2D visualization and quantification of the length L of the photoconverted tissue. |
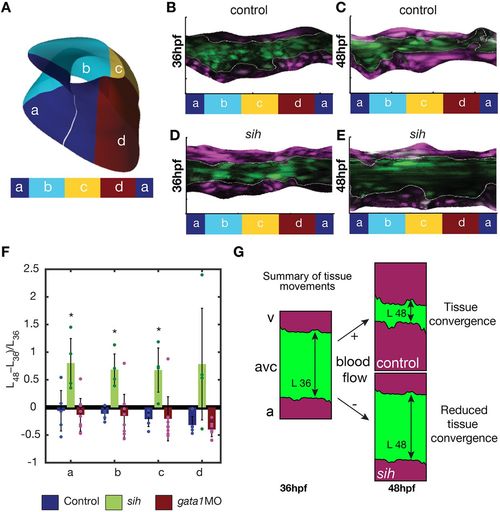
Tissue convergence (AVC shortening) is flow dependent. (A) Schematic showing the compartmentalization into superior (a), inferior (c), exterior (b) and interior (d) regions of the AVC. (B-E) Unfolded visualization of the fli:kaede (control) (B,C) and sih;fli:kaede AVC endocardium (D,E) at 36 hpf (B,D) and 48 hpf (C,E). (F) The shortening index (L48−L36)/L36 of the AVC between 36 hpf and 48 hpf in control (n=5), sih (n=4) and gata1 (n=9) morphants is averaged on the a,b,c,d regions. L48 and L36 are the AVC length L at 48 hpf and 36 hpf, respectively. Data are mean±s.d. Statistical significance was determined by unpaired Student's t-test; *0.01<P<0.05. (G) Schematic of flow-dependent tissue convergence. |
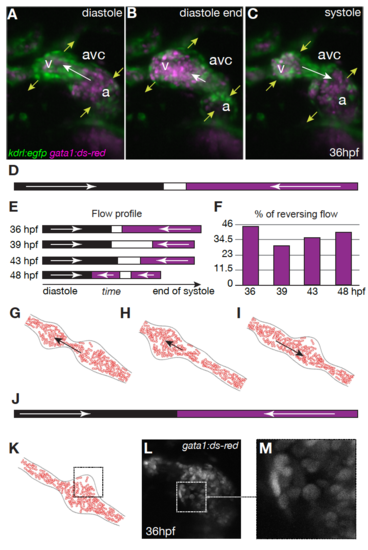
Reversing, oscillatory flow in the AVC between 36 and 48 hpf. A-C) Maximum projection of the three-dimensional reconstruction of a 36 hpf Tg(fli:kaede;gata1:dsRed) zebrafish heart at three different instants of the heart beat. The dsred labelled red blood cells are shown in magenta, while endocardial cells are shown in green. D,E) Flow direction in the AVC at D) 36hpf and E) between 36-48 hpf: magenta, flow moves from atrium to ventricle; black, flow is from ventricle to atrium; white, no flow or not visible. F) Average percentage of reversing flow per heart beat. G-I) Computational model for RBC flows between 36-48 hpf at three different instants of the heart beat (cf. Movie 1). J) Flow direction in the AVC model: solid arrows point in the direction of the flow. Dashed squares point out the uneven-time dependent distribution of RBCs in K) the model, and L,M) in vivo. |

Model sensitivity to red blood cell (RBC) shape and stiffness. Related to Fig. 3. A) Computational model for RBC flows at three different instants of the heart beat for round elastic red blood cells (cf. Fig. S1G-I). B) Flow direction in the AVC model: magenta, flow is from atrium to ventricle; black, flow is from ventricle to atrium; white, no flow or not visible. Solid arrows point in the direction of the flow. C) Fundamental harmonic T1, D) time average T0, and E) non-periodic oscillation ~ of the shear stress. C-E) The blue solid line corresponds to the RBC shape of the test case of Fig. S1 and 3, np =106, and Trlx/TU = 0:16. The three dashed lines correspond to the rounder RBC shape shown in A and are obtained using the same, stiffer (Trlx=TU = 0:1), and softer (Trlx=TU = 0:32) RBC membranes (dashed arrow points to larger value of stiffness). The superscript denotes that results are normalized by the space average of ftf1/r/dt.. a: atrium; avc: atrioventricular canal; v: ventricle. |