
- Title
-
Alkbh4 and Atrn Act Maternally to Regulate Zebrafish Epiboly
- Authors
- Sun, Q., Liu, X., Gong, B., Wu, D., Meng, A., Jia, S.
- Source
- Full text @ Int. J. Biol. Sci.

Spatiotemporal expression pattern of alkbh4 in zebrafish embryos. (A) mRNA levels of alkbh family members in zebrafish oocyte and 1-cell embryo from RNA-seq data. Normalized transcripts number per million of alkbh1-8 and fto transcripts are shown. (B) Protein sequences alignment of Alkbh4 among different species. (C) alkbh4 mRNA expression pattern in wild-type zebrafish embryos were detected by whole-mount in situ hybridization at indicated stages. (D, E) Semi-quantitative RT-PCR detection of zebrafish alkbh4 mRNA level at indicated stages. The relative expression ratio was calculated from the band intensity between alkbh4 and β-actin (internal control). Scale bars: 100 μm in (C). |
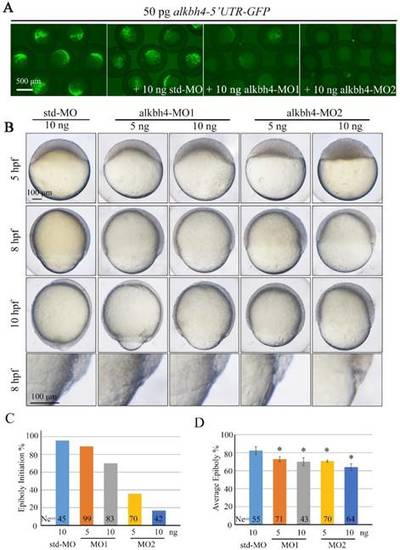
Morpholino knockdown of alkbh4 leads to epiboly initiation and progression delays. (A) Effectiveness of alkbh4 morpholinos. 50 pg alkbh4-5'UTR-GFP plasmid DNA was injected alone or with 10 ng std-MO, alkbh4-MO1 or alkbh4-MO2 at 1-cell stage. The injected embryos were observed for GFP expression at late gastrulation stages. (B) Morpholino knockdown of alkbh4 leads to epiboly delay in a dose dependent manner. Embryos were observed and photographed at indicated stages. Magnified observations of the embryonic marginal cell layers are shown at the last panel. (C) Epiboly initiation in (B) was measured by the percentage of embryos with yolk cell doming at 5 hpf. (D) Epiboly progression in (B) was measured by the average epiboly percentage of the embryos at 8 hpf. Ne, the number of observed embryos. *, p<0.01. Scale bars: 500 μm in (A); 100 μm in (B). PHENOTYPE:
|
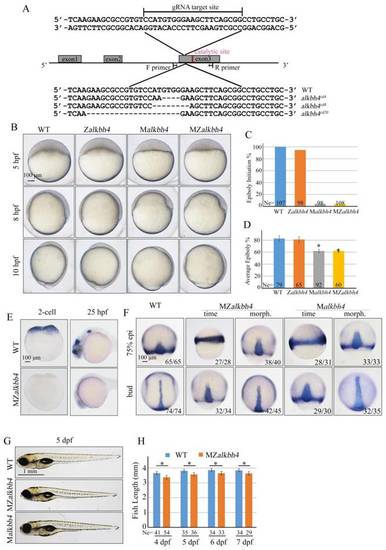
Maternal alkbh4 mutation leads to epiboly delay. (A) CRISPR/Cas9-mediated deletion of alkbh4. Zebrafish alkbh4 contains 3 exons, and gRNA was designed to target the third exon. A specific genomic region was amplified from F2 individual embryo and sent for sequencing. The sequencing results of target sites are shown below, including the wild-type form and three kinds of alkbh4 mutant forms. (B) Maternal but not zygotic alkbh4 mutation results in epiboly initiation and progression delays. Wild-type, Zalkbh4, Malkbh4 and MZalkbh4 mutant embryos were collected after fertilization at the same time and then imaged at the indicated time points. (C) Epiboly initiation in (B) was measured by the percentage of embryos with yolk cell doming at 5 hpf. (D) Epiboly progression in (B) was measured by the average epiboly percentage of the embryos at 8 hpf. (E) In situ hybridization results of alkbh4 mRNA expression in wild-type and MZalkbh4 embryos at 2-cell and 25 hpf stages are shown. (F) CE movements are defective in MZalkbh4 and Malkbh4 mutant embryos. The mutant embryos were collected not only at the same time point but also at the morphologically comparable stages compared with wild-type embryos. dlx3b and ntla probes were used simultaneously for in situ hybridization. The ratios of embryos with representative pattern are indicated at the right corner of each picture. (G) The body length decreases in MZalkbh4 and Malkbh4 mutant larvae. Representative pictures of wild-type and mutant larvae at 5 dpf are shown. (H) The body lengths of wild-type and MZalkbh4 mutant larvae at 4 dpf, 5 dpf, 6 dpf and 7 dpf were measured by Image J software. The statistical results are shown here. Ne, the number of observed embryos. *, p<0.01. Scale bars: 100 μm in (B, E, F); 1 mm in (G). |
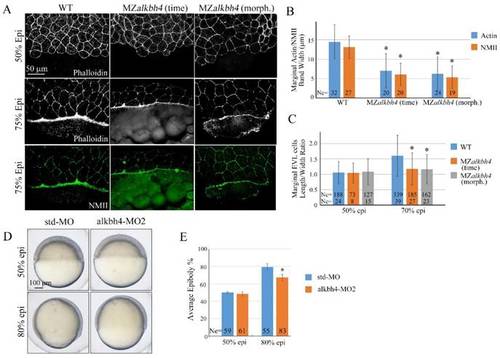
alkbh4 regulates actomyosin band formation in MZalkbh4 embryos. (A) Confocal images of phalloidin stained embryos at 50% epiboly, and phalloidin and anti-NMII double stained embryos at 75% epiboly. phalloidin and anti-NMII co-staining showing the defects of actomyosin band formation and marginal EVL cells morphology in MZalkbh4 embryos. The mutant embryos were collected not only at the same time point but also at the morphologically comparable stages compared with wild-type embryos. Embryos were laterally viewed with animal pole to the top and vegetal pole to the bottom. (B) Quantitative measurements of actomyosin band widths in (A) at 75% epiboly stage, which were represented by the widths of Actin and NMII staining in the E-YSL separately. (C) Quantitative measurements of the marginal EVL cell length/width ratios in (A) at both 50% and 75% epiboly. Ne, the number of observed embryos; Nc, the number of observed cells. *, p<0.01. (D) Epiboly defects caused by YSL-injection of alkbh4-MO2. At 4 hpf, 10 ng std-MO and alkbh4-MO2 were injected into the yolk cell of embryos and epiboly progression were observed at 50% and 80% epiboly stages. (E) Epiboly progression in (D) was measured by the average epiboly percentage of the embryos. Ne, the number of observed embryos. *, p<0.01. Scale bars: 50 μm in (A); 100 μm in (D). EXPRESSION / LABELING:
PHENOTYPE:
|
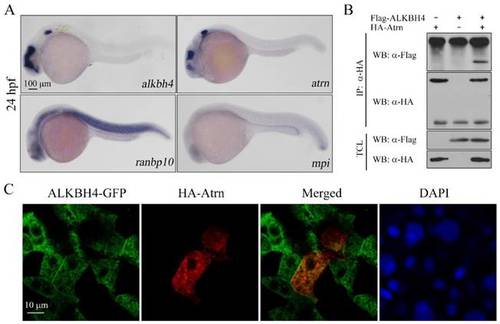
Alkbh4 associates and co-localizes with Atrn. (A) Whole-mount in situ hybridization results of putative Alkbh4 binding partners, including atrn, ranbp10 and mpi. Only the expression pattern of atrn is similar to that of alkbh4 at 24 hpf. (B) Flag-ALKBH4 was co-expressed with HA-Atrn in HEK293T cells and their interaction was examined by immunoprecipitation. HA-Atrn was immunoprecipitated with anti-HA antibody and the precipitates were examined by western blotting for the presence of ALKBH4 with anti-Flag antibody. TCL, total cell lysate. (C) Co-localization of ALKBH4-GFP with HA-Atrn in zebrafish embryonic cells. HA-Atrn plasmid DNA and ALKBH4-GFP mRNA were injected into one cell at 4-cell stage of the embryos. Embryos were double stained with corresponding antibodies at 75% epiboly stage. Scale bars: 100 μm in (A); 10 μm in (C). EXPRESSION / LABELING:
|
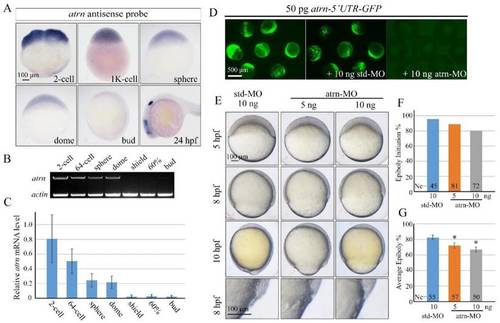
Morpholino knockdown of atrn leads to epiboly delay. (A) atrn mRNA expression pattern in wild-type embryos was detected by whole-mount in situ hybridization at indicated stages. (B, C) Semi-quantitative RT-PCR detection of zebrafish atrn mRNA level at indicated stages. The relative expression ratio was calculated from the band intensity between atrn and β-actin (internal control). (D) Effectiveness of atrn morpholino. 50 pg atrn-5'UTR-GFP plasmid DNA was injected alone or with 10 ng std-MO or atrn-MO at 1-cell stage. The injected embryos were observed for GFP expression at late gastrulation stages. (E) Morpholino knockdown of atrn results in epiboly delay in a dose dependent manner. Embryos were observed and imaged at indicated stages. Magnified observations of the embryonic marginal cell layers are shown at the last panel. (F, G) The quantitative data of epiboly initiation at 5 hpf and epiboly progression at 8 hpf in (E) are shown. *, p<0.01. Scale bars: 100 μm in (A, E); 500μm in (D). PHENOTYPE:
|
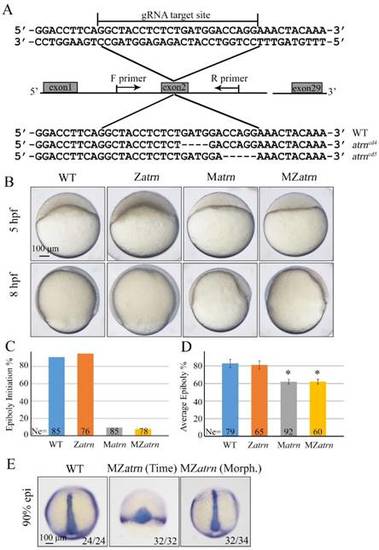
Maternal atrn mutation leads to epiboly delay. (A) CRISPR/Cas9-mediated deletion of atrn. Zebrafish atrn contains 29 exons, and gRNA was designed to target the second exon. Sequencing results of the target sites from several individual F2 embryos are shown below, including the wild-type form and two atrn mutant forms. (B) Maternal but not zygotic atrn mutation results in epiboly initiation and progression delays. Wild-type, Zatrn, Matrn and MZatrn mutant embryos were collected after fertilization at the same time and then imaged at indicated time points. (C, D) The quantitative data of epiboly initiation at 5 hpf and epiboly progression at 8 hpf in (B) are shown. (E) CE movements appear essentially normal in MZatrn mutant embryos. The mutant embryos were collected at both same time and morphologically comparable stages with wild-type embryos. dlx3b and ntla probes were used simultaneously for in situ hybridization. The ratios of embryos with representative pattern are indicated at the right corner of each picture. *, p<0.01. Scale bars: 100 μm in (B, E). EXPRESSION / LABELING:
PHENOTYPE:
|
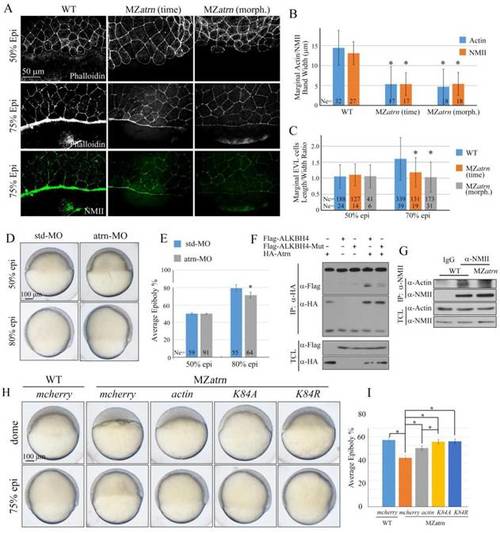
Atrn regulates actomyosin formation and Actin-NMII interaction in zebrafish embryos. (A) Confocal images of phalloidin stained embryos at 50% epiboly, and phalloidin and anti-NMII double stained embryos at 75% epiboly. The mutant embryos were collected at both the same time point and comparable morphological stages compared with wild-type embryos. Embryos were laterally viewed with animal pole to the top and vegetal pole to the bottom. (B) Quantitative measurements of actomyosin band widths in (A) at 75% epiboly stage, which are represented by the widths of Actin and NMII staining in the E-YSL separately. (C) Quantitative measurements of the marginal EVL cell length/width ratios in (A) at both 50% and 75% epiboly stages. Ne, the number of observed embryos; Nc, the number of observed cells. (D) Epiboly defects caused by YSL-injection of atrn-MO. 10 ng std-MO and atrn-MO were used. (E) Epiboly progression in (D) was measured by the average epiboly percentage of the embryos. (F) Atrn associated with less catalytically inactive form of ALKBH4 (ALKBH4-Mut), as revealed by co-IP in HEK293T cells. (G) Co-IP assay shows that endogenous Actin-NMII interaction is decreased in MZatrn mutant embryos. Embryos at 75% epiboly were harvested for lysis and Co-IP. (H) Rescue effects of wild-type and two methylation-deficient actin mRNAs in MZatrn embryos. 100 pg mcherry and different forms of actin mRNA were used for injection. Embryos injected with 100 pg mcherry mRNA were used as negative controls. Embryos were observed at dome and 75% epiboly stages, and shown as lateral views. (I) Statistical results of (H). *, p<0.01. Scale bars: 50 μm in (A); 100 μm in (D, H). EXPRESSION / LABELING:
PHENOTYPE:
|
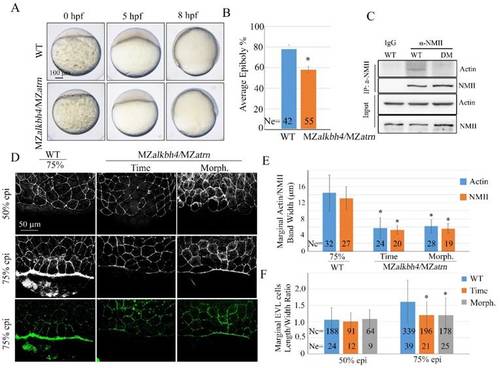
Epiboly and actomyosin formation are defective in MZalkbh4;MZatrn double mutant embryos. (A) Epiboly initiation and progression delay in MZalkbh4;MZatrn double mutants. (B) The quantitative data of epiboly progression at 8 hpf are shown. (C) Co-IP assay shows that endogenous Actin-NMII interaction is decreased in alkbh4 and atrn double morphant embryos. Embryos at 75% epiboly stage were harvested for lysis. (D) Confocal images of phalloidin stained embryos at 50% epiboly, and phalloidin and anti-NMII double stained embryos at 75% epiboly. (E) Quantitative measurements of actomyosin band widths in (D) at 75% epiboly stage. (F) Quantitative measurements of the marginal EVL cell length/width ratios in (D) at both 50% and 75% epiboly stages. Ne, the number of observed embryos; Nc, the number of observed cells. *, p<0.01. Scale bars: 100 μm in (A); 50 μm in (D). EXPRESSION / LABELING:
PHENOTYPE:
|
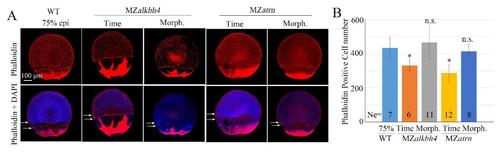
EVL and deep cell movements are defective in MZalkbh4 and MZatrn embryos, while the cell number per embryo is not obviously affected. (A) Whole-mount phalloidin and DAPI staining were used to observe the marginal positions of EVL and deep cells. White arrows indicate the marginal positions of deep cells; yellow arrows indicate the marginal positions of EVL cells. The mutant embryos were collected at both the same time point and comparable morphological stages compared with wild-type embryos at 75% epiboly stage. (B) The quantitative data of phalloidin-positive EVL cell numbers were derived from 3D images of the embryos in (A). Ne, the number of observed embryos. *, p<0.01; n.s. indicates no significant difference. Scale bars 100 µm in (A). |
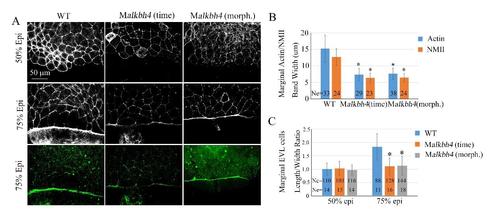
Actomyosin band formation in the E-YSL and marginal EVL cells morphology are affected in Malkbh4 embryos. (A) phalloidin and anti-NMII co-staining showing the defects of actomyosin band formation and marginal EVL cells morphology in Malkbh4 embryos. (B) Quantitative measurements of actomyosin band widths in (A) at 75% epiboly stage. (C) Quantitative measurements of the marginal EVL cell length/width ratios in (A) at both 50% and 75% epiboly. Ne, the number of observed embryos; Nc, the number of observed cells. *, p<0.01. Scale bar: 50 µm in (A). |
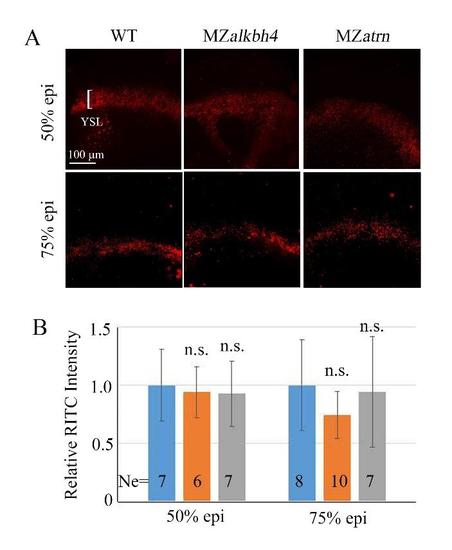
E-YSL endocytosis is not affected in MZalkbh4 or MZatrn mutant embryos. (A) Fluorescence images of live embryos showing endocytic vesicles in red in the E-YSL. Embryos at 50% and 75% epiboly stages were incubated in 10 mg/ml Rhodamine B isothiocyanate-Dextran for 30 minutes, and imaged by confocal microscope. (B) The quantitative data of fluorescence intensity measured by image J software are derived from (A). Ne, the number of observed embryos. n.s. indicates no significant difference. Scale bar: 100 µm in (A). |
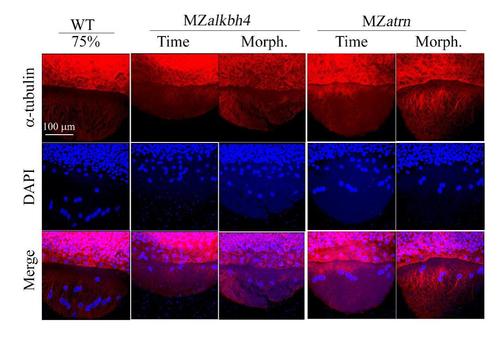
Microtubule arrays in MZalkbh4 and MZatrn mutant embryos are not significantly altered. Confocal images of anti-α-tubulin and DAPI stained embryos at 75% epiboly stages. The mutant embryos were collected at both the same time point and comparable morphological stages compared with wild-type embryos. Scale bar: 100 µm. |
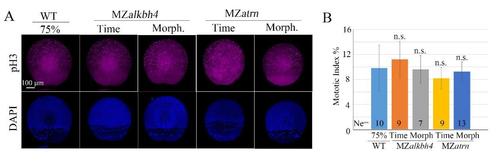
Cell proliferation is not obviously affected in MZalkbh4 and MZatrn mutant embryo. (A) Confocal images of anti-pH3 and DAPI staining at 75% epiboly stage. Cell proliferation was not obviously affected in the mutants. (B) Mitotic indexes of (A) were characterized by the percentage of pH3-positive cell number to DAPI-positive cell number. Ne, the number of observed embryos. *, p<0.01; n.s. indicates no significant difference. Scale bars 100 µm in (A). |