
|
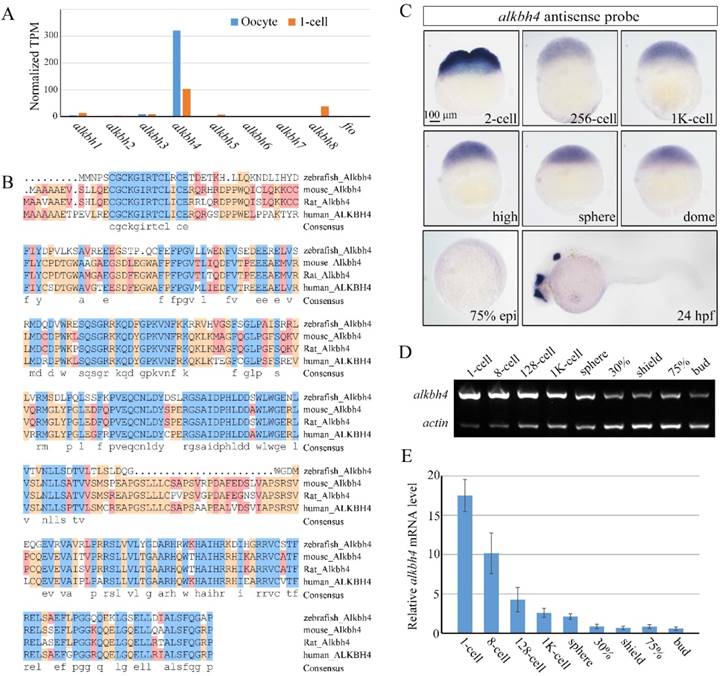
Fig. 1
Spatiotemporal expression pattern of alkbh4 in zebrafish embryos. (A) mRNA levels of alkbh family members in zebrafish oocyte and 1-cell embryo from RNA-seq data. Normalized transcripts number per million of alkbh1-8 and fto transcripts are shown. (B) Protein sequences alignment of Alkbh4 among different species. (C) alkbh4 mRNA expression pattern in wild-type zebrafish embryos were detected by whole-mount in situ hybridization at indicated stages. (D, E) Semi-quantitative RT-PCR detection of zebrafish alkbh4 mRNA level at indicated stages. The relative expression ratio was calculated from the band intensity between alkbh4 and β-actin (internal control). Scale bars: 100 μm in (C).