
- Title
-
High-Resolution Magnetic Resonance Imaging of the Regenerating Adult Zebrafish Heart
- Authors
- Koth, J., Maguire, M.L., McClymont, D., Diffley, L., Thornton, V.L., Beech, J., Patient, R.K., Riley, P.R., Schneider, J.E.
- Source
- Full text @ Sci. Rep.
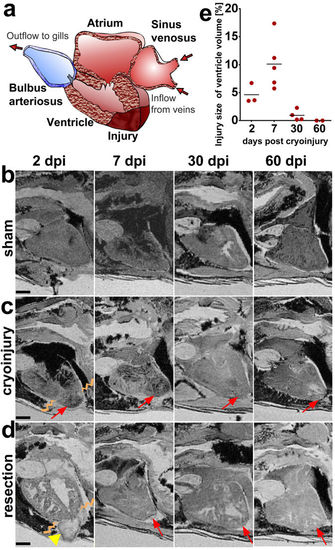
Ex vivo MRI of heart regeneration in different fixed specimens. (a) Schematic drawing of the zebrafish heart in sagittal section view as in the MR images below. The apex of the ventricle is drawn with a cryoinjury to illustrate the location of the lesions. (b–d) Optical sagittal MR sections showing the regeneration process in (b) sham operated controls, (c) cryo-injured, and (d) resected ventricles at 2, 7, 30, and 60 days post injury (dpi) in wt fish. The lesion is indicated with an arrow and the blood clot after resection is indicated with an arrow-head. The border between healthy and damaged heart tissue is indicated by zig-zag lines at 2 dpi. (e) Graph showing the cryoinjury volume in percentage of the ventricular volume at the 4 time points (see c) investigated for 13 individual fixed specimen [lesion size per ventricle (Y) and the mean value (bar line) at each post injury time point (X)] demonstrating the variability of the lesions between specimen. Anterior to the left, dorsal to the top. n/ time point = 2 per sham group and 4 per injury group. Scale bar 0.5 mm. |
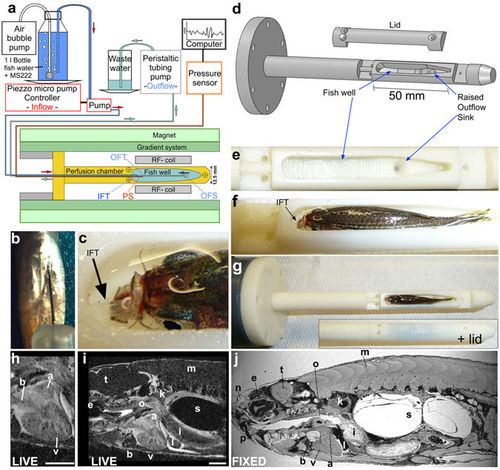
Respiratory and anaesthesia perfusion set-up for adult zebrafish in vivo imaging. (a) Schematic drawing of the perfusion system and MRI set-up. IFT – inflow tube, OFS – outflow sink, OFT – outflow tube, PS - pressure sensor (b) Ventral view (anterior at the top) of a zebrafish showing an intra-peritoneal injection of contrast agent prior to MRI. (c) Photograph showing the thin transparent respiratory perfusion inflow tube (IFT, arrow) positioned in the zebrafish mouth. Note the water level is above the eyes of the fish and covers the gills. (d) Drawing of the fish perfusion chamber as used for 3D printing illustrating the contours of the fish well. (e) Empty fish well of the perfusion chamber (view from top) with the outflow sink visible. (f) Fish well containing an adult zebrafish with perfusion inflow tube (IFT, arrow) in its mouth ready for imaging (see also c). Note the fish is 2/3 covered with water and eyes and gills are submerged. (g) Whole perfusion chamber (top view) containing a fish with and without the lid. The perfusion chamber is screwed onto a larger tube (dark grey) to insert it into the MR magnet. (h–i) Single image plane of a 3D image stack of a live adult zebrafish heart (h) or the whole scan field (i) from eye to mid swim bladder in (sagittal view). Scale bar 1mm. (j) Single image plane of a 3D image stack of a paraformaldehyde-fixed adult zebrafish in sagittal view. a-atrium, b-bulbus arteriosus, e-eye, i-intestine, k-kidney, l-liver, m-muscle, n-olfactory pit, o-oesophagus, p-pharynx, s-swim bladder, t-tectum opticum, v-ventricle. |
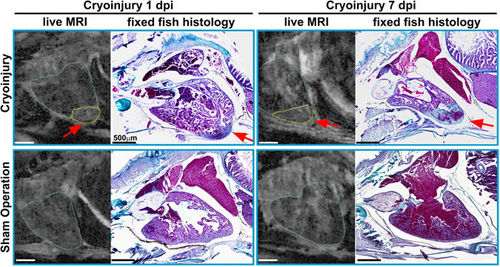
Confirming in vivo MRI with histology: MR images of the live ventricle in two cryo-injured (see arrows and outlined in yellow) and two sham operated wt fish at 1 and 7 days post injury and their corresponding histological sections. To confirm proper identification of the injury, the fish were sacrificed and fixed for histology within minutes after the in vivo scan. Trichrome staining was used to highlight the injured region in the same heart; collagen appears blue (highlighting the injury region) and cytoplasm pink. n = 2 per group. Scale bar 0.5 mm. |
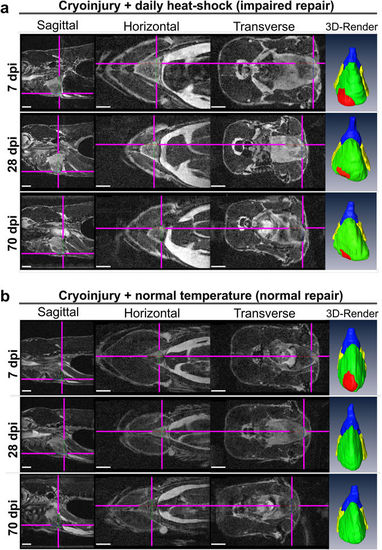
Impaired heart regeneration in a live specimen can be followed for at least 70 days. Orthogonal views of MR images of the two cryo-injured live Tg(hsp70l:dnfgfr1a-EGFP) +/− fish with (a) and without (b) daily heat-shock (HS) treatment at 7, 28, and 70 days post injury. Shown is the precise location of the lesion in each fish in 3 optical planes (sagittal, horizontal and transverse) and as a ventral view 3D Amira reconstruction (3D Render) of the heart (red-lesion, green-ventricle, blue-bulbus arteriosus, yellow-atrium). The injury location is indicated in each plane by pink crosshair lines, in order not to obscure the heart, the cross-hairs are drawn thinner above the heart and injury site. n = 4 per group. Scale bar 1 mm. PHENOTYPE:
|
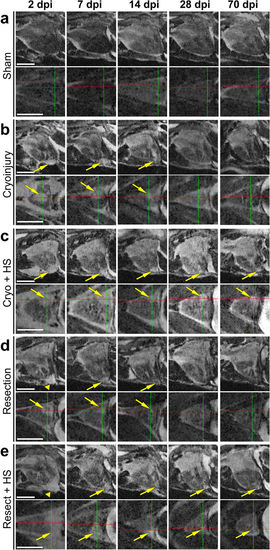
Comparing well and poorly healing hearts for 70 days post injury (dpi). (a–e) Optical sagittal and horizontal MR sections of 5 individual Tg(hsp70l:dnfgfr1a-EGFP) +/− adult fish imaged repeatedly over 70 days showing (a) a sham control ventricle (no injury but opened pericardium), and the regeneration process in (b) cryo-injured and (d) resected ventricles, and (c) cryo-injured plus heat-shock (HS) and (e) resected plus HS treated ventricles at 2, 7, 14, 28, and 70 days post injury (dpi). b + d serve as injured but not HS treated controls to visualise normal versus impaired (c + e) heart repair. Arrows point to the injury location and arrowheads indicate the blood clot following resection injury. Scale bar 1 mm. PHENOTYPE:
|