
- Title
-
Cos2/Kif7 and OSM-3/Kif17 Regulate Onset of Outer Segment Development in Zebrafish Photoreceptors Through Distinct Mechanisms
- Authors
- Lewis, T.R., Kundinger, S.R., Pavlovich, A.L., Bostrom, J.R., Link, B.A., Besharse, J.C.
- Source
- Full text @ Dev. Biol.
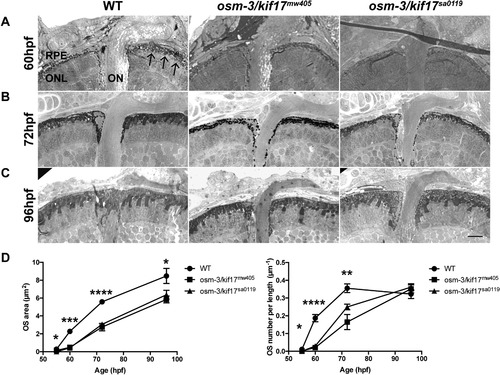
osm-3/kif17mw405 and osm-3/kif17sa0119 both result in a OS developmental delay. A. Plastic histology at 60hpf reveals several small OS (arrow) in the central retina of wild-type embryos, but OS are virtually absent in osm-3/kif17mw405 and osm-3/kif17sa0119 retinas. B. At 72hpf, wild-type OS begin to elongate and are more numerous, while osm-3/kif17mw405 and osm-3/kif17sa0119 retinas have few and small OS. C. At 96hpf, osm-3/kif17mw405 and osm-3/kif17sa0119 retinas appear to have comparable OS densities, although the size still appears smaller. Scale bar is 10 μm. D. (Left) Quantification of the average area of an individual OS during the first 4dpf. At all time-points measured, the decrease in size of both osm-3/kif17 mutants is statistically significant. For all genotypes, 100 total OS were measured for each of five biological replicates at each timepoint. (Right) Quantification of the average density of OS in number of OS per length of RPE. During the initial 72hpf, the decrease in numbers of both osm-3/kif17 mutants is statistically significant. For all genotypes, a total length of 250 µm of RPE was measured for each of five biological replicates at each timepoint. |

cos2/kif7mw406 results in a OS developmental delay. A. Plastic histology at 60hpf reveals OS are virtually absent in cos2/kif7mw406 retinas compared to the presence of numerous OS in controls (arrows). B. At 72hpf, cos2/kif7mw406 have few and small OS compared to controls. C. At 96hpf, cos2/kif7mw406 retinas have comparable OS densities, although the size still appears smaller. Scale bar is 10 μm. D. (Top) Quantification of the average area of an individual OS during the first 4dpf. At all time-points measured, the decrease in size of cos2/kif7mw406 OS is statistically significant. For both genotypes, 100 total OS were measured for each of five biological replicates at each timepoint. (Bottom) Quantification of the average number of OS per length of RPE. During the initial 72hpf, the decrease in numbers of both cos2/kif7 mutants is statistically significant. For all genotypes, a total length of 250 µm of RPE was measured for each of five biological replicates at each timepoint. |
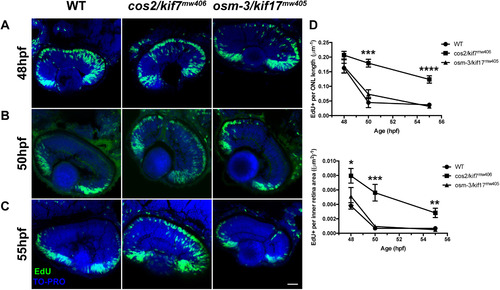
cos2/kif7mw406 exhibit delayed retinal neurogenesis. A. At 48hpf, embryos were incubated with EdU for 15-min to label cells in S-phase of the cell cycle. Nearly every presumptive photoreceptor in the ONL is labeled with the EdU (green). All nuclei were labeled with TO-PRO (blue). B. 50hpf embryos were given an identical EdU treatment. cos2/kif7mw406 presumptive photoreceptors remained strongly labeled by the EdU, while control and osm-3/kif17mw405 presumptive photoreceptors do not. C. EdU treatment of 55hpf embryos shows that although decreased from previous time-points, cos2/kif7mw406 presumptive photoreceptors remained labeled by the EdU. Scale bar is 25 µm. D. (Top) Quantification of the number of presumptive photoreceptor nuclei labeled by the EdU treatment as a measure of the total length of ONL. The number of EdU positive nuclei were counted among several images along a total average ONL length of 408±26 µm for five biological replicates at each timepoint for each genotype. At 48hpf, presumptive photoreceptors of each genotype are strongly labeled by EdU, while cos2/kif7mw406 labeling remains significantly increased through 55hpf. (Bottom) Quantification of the number of inner retinal cells (including INL and GCL) labeled by the EdU treatment as a measure of the total inner retinal area. The number of EdU Positive nuclei were counted among several images within a total average inner retina area of 14000±500 µm2 for five biological replicates at each timepoint for each genotype. Inner retinal cells have increased EdU incorporation between 48hpf and 55hpf. PHENOTYPE:
|

ZFIN is incorporating published figure images and captions as part of an ongoing project. Figures from some publications have not yet been curated, or are not available for display because of copyright restrictions. PHENOTYPE:
|
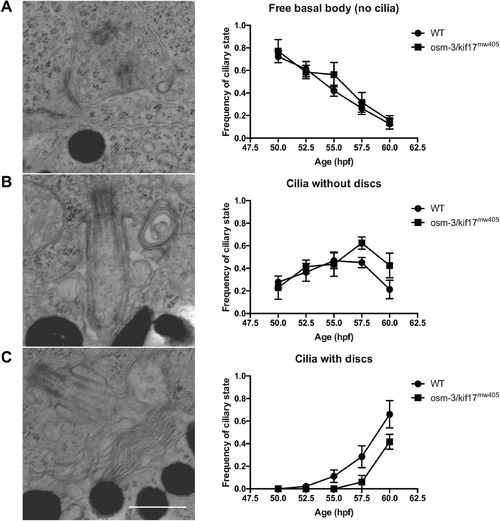
osm-3/kif17mw405 cilia appear to form normally, although disc formation is delayed. A-C. TEM was performed on three wild-type and osm-3/kif17mw405 embryos at each of five timepoints during the early stages of OS morphogenesis between 50hpf and 60hpf. An average of 22±1 basal bodies were imaged for each sample and categorized into one of three ciliary states: no cilia (A), cilia without discs (B), or cilia with discs (C). Scale bar is 0.5 µm. While there does not appear to be a delay in initial ciliogenesis, disc morphogenesis specifically appears to be delayed in osm-3/kif17mw405 embryos. |
|
ZFIN is incorporating published figure images and captions as part of an ongoing project. Figures from some publications have not yet been curated, or are not available for display because of copyright restrictions. PHENOTYPE:
|
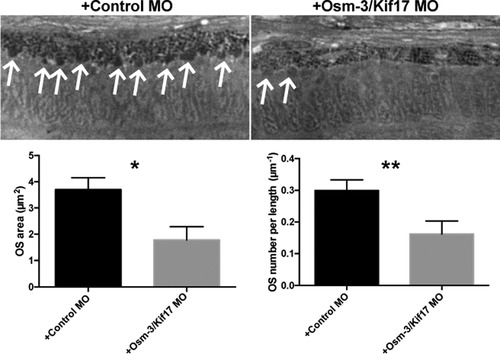
osm-3/kif17 morphants have a reduction in both OS number and size. (Top) Wild-type embryos were injected with either a control morpholino (+Control MO) or osm-3/kif17 splice site junction morpholino (+Osm-3/Kif17 MO) and raised to 72hpf. Plastic histology reveals several evenly sized and uniformly distributed OS in the central retina of control morpholino-injected embryos (arrows), but OS are unevenly distributed and variable in size in osm-3/kif17 morpholino-injected embryos (arrows). (Bottom) Five biological replicates for each genotype were quantified as described above for the average OS area and density. osm-3/kif17 morpholino-injected embryos have approximately half as many OS, and OS that are approximately half the size of controls. PHENOTYPE:
|
|
ZFIN is incorporating published figure images and captions as part of an ongoing project. Figures from some publications have not yet been curated, or are not available for display because of copyright restrictions. EXPRESSION / LABELING:
PHENOTYPE:
|
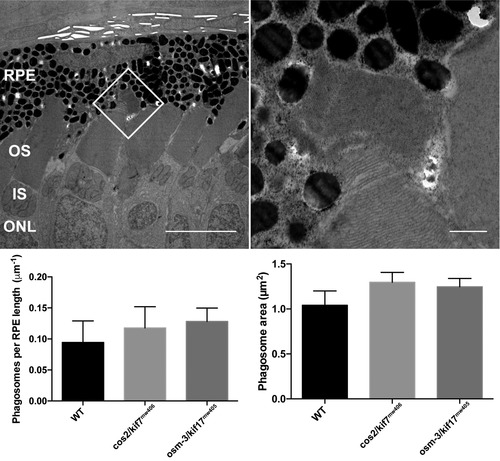
Disc shedding is unaffected in osm-3/kif17mw405 and cos2/kif7mw406 retina. (Top, Left) TEM image of 7dpf wild-type retina. Depicted is an OS that has recently undergone disc shedding with a phagosome at the OS tip. Scale bar is 5 µm. (Top, Right) Inset of the white box of the left image clearly showing the phagosome as a distinct structure from the OS. Scale bar is 500 nm. (Bottom) Quantification of disc shedding in control, osm-3/kif17mw405, and cos2/kif7mw406 retina. Phagosomes were counted along an average total length of 235±2 µm of RPE for four biological replicates of each genotype. Neither the number of phagosomes per length of RPE nor the area of individual phagosomes show any significant differences between genotypes. PHENOTYPE:
|
|
Unillustrated author statements |
Reprinted from Developmental Biology, 425(2), Lewis, T.R., Kundinger, S.R., Pavlovich, A.L., Bostrom, J.R., Link, B.A., Besharse, J.C., Cos2/Kif7 and OSM-3/Kif17 Regulate Onset of Outer Segment Development in Zebrafish Photoreceptors Through Distinct Mechanisms, 176-190, Copyright (2017) with permission from Elsevier. Full text @ Dev. Biol.