
- Title
-
Cystinosis (ctns) zebrafish mutant shows pronephric glomerular and tubular dysfunction
- Authors
- Elmonem, M.A., Khalil, R., Khodaparast, L., Khodaparast, L., Arcolino, F.O., Morgan, J., Pastore, A., Tylzanowski, P., Ny, A., Lowe, M., de Witte, P.A., Baelde, H.J., van den Heuvel, L.P., Levtchenko, E.
- Source
- Full text @ Sci. Rep.
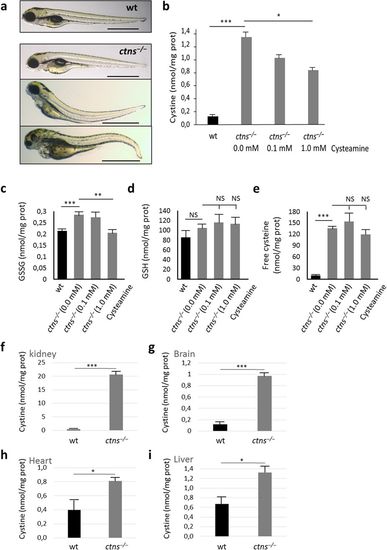
(a) Morphology of wild-type and ctns−/− larvae at 4 dpf. Wild-type larva shows normal morphology, while mutant ctns−/− larvae show various degrees of developmental delay and deformity: upper larva show signs of growth retardation in the form of slightly bigger yolk, bulging heart and bent-down head, while the middle and lower larvae show mild and severe deformity, respectively (bars = 1 mm). (b) Cystine content in homogenates of 6 dpf wt or ctns−/− zebrafish larvae. ctns−/− larvae were either free of treatment (N = 133) or subjected to 0.1 or 1.0 mM of cysteamine in the swimming water (N = 111 and 121 larvae, respectively). Comparison was performed with wt larvae (N = 191). (c) Oxidized glutathione (GSSG) content in homogenates of 6 dpf wt or ctns−/− zebrafish larvae (same conditions and larval numbers as cystine). (d) Total glutathione (GSH) content in homogenates of 6 dpf wt or ctns−/− zebrafish larvae. ctns−/− larvae were either free of treatment (N = 80) or subjected to 0.1 or 1.0 mM of cysteamine in the swimming water (N = 108 and 104 larvae, respectively). Comparison was performed with wt larvae (N = 158). (e) Free cysteine content in homogenates of 6 dpf wt or ctns−/− zebrafish larvae (same conditions and larval numbers as GSH). (f–i) Cystine content in homogenates of 8-month-old adults (Kidney, brain, heart and liver, respectively) (N = 3 of each genotype). Concentrations of cystine and other thiol compounds were expressed as nmol/mg protein. *P < 0.05, **P < 0.01, ***P < 0.001. |

ZFIN is incorporating published figure images and captions as part of an ongoing project. Figures from some publications have not yet been curated, or are not available for display because of copyright restrictions. PHENOTYPE:
|
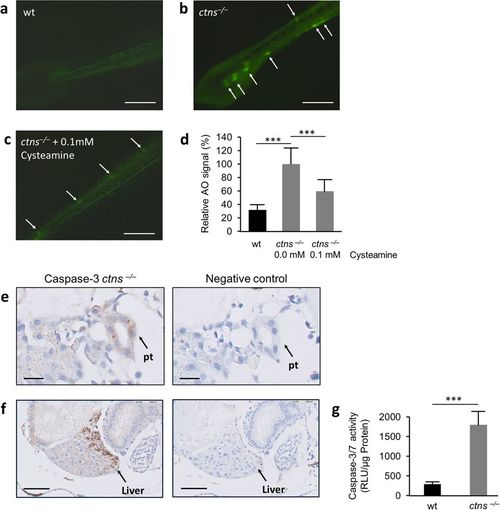
(a–d) Acridine orange: Five dpf wt larvae and ctns−/− larvae, naïve to treatment or treated with 0.1 mM of cysteamine (N = 10 for each group), were incubated with Acridine Orange (AO). Fluorescent spots (white arrows) were delineated in high magnification mode and quantified by ImageJ software. (a) A representative tail segment of 5 dpf wt larva (bar = 200 μm). (b) A representative tail segment of 5 dpf ctns−/− untreated larva (bar = 200 μm). (c) A representative tail segment of 5 dpf ctns−/− larva treated with 0.1 mM cysteamine (bar = 200 μm). (d) Quantitation of the relative fluorescence intensity of apoptotic spots. Average intensity of untreated ctns−/− larvae was set at 100%. *** P < 0.001 against untreated ctns−/− larvae. (e,f) Caspase-3 immunohistochemistry. (e) Representative images showing increased apoptotic signal over the proximal tubule in 5 dpf ctns−/− larva (left) compared to the negative control (right), bar = 10 μm. pt, proximal tubule. (f) Representative images showing increased apoptotic signal over the liver in 5 dpf ctns−/− larva (left) compared to the negative control (right), bar = 30 μm. Rabbit serum was used for the negative control sections instead of 1ry Ab. (g) Caspase-3/7 enzyme activity. Quantitation of Caspase-3/7 enzyme activity by a luciferase based assay in the homogenates of 5 dpf wt and ctns‒/‒ larvae (On average 60 larvae over 3 separate homogenates for each genotype were used). Results were expressed in luminescence units (RLU)/μg protein of each homogenate. ***P < 0.001. |
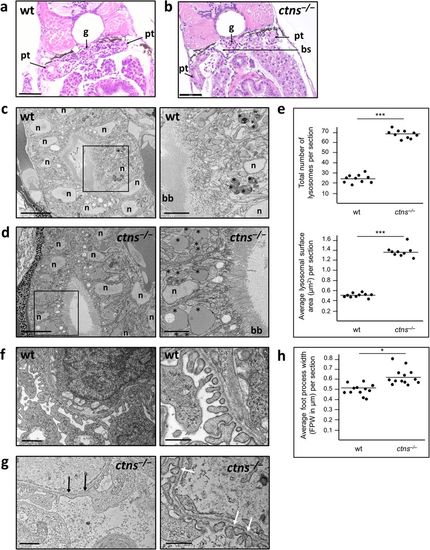
(a) H&E stained cut-section of a 6 dpf wt larva at the level of the glomerulus and proximal tubules (bar = 50 μm). (b) H&E stained cut-section of a 6 dpf ctns−/− larva at the level of the glomerulus and proximal tubules showing no apparent abnormality (bar = 50 μm). (c) Block face scanning EM image of the proximal tubule of a 4 dpf wt larva (bar = 5 μm). Demarcated area was magnified (right) to show size and distribution of lysosomes (asterisks) in the wt (bar = 2 μm). (d) Block face scanning EM image of the proximal tubule of a 4 dpf ctns−/− larva showing intact brush border (bar = 5 μm). Demarcated area was magnified (right) to show larger number of lysosomes (asterisks) many of which were significantly enlarged in size compared to the wt (bar = 2 μm). (e) Quantitation of the number and surface area of lysosomes in cut sections at the level of proximal tubules in both genotypes. (f) Transmission EM image of the glomerulus of a 6 dpf wt larva showing normal foot processes (bar = 2 μm). A magnified EM image (right) of podocytes of 6 dpf wt larva showing preserved podocytes slit diaphragms (bar = 1 μm). (g) Transmission EM image of the glomerulus of a 6 dpf ctns−/− larva showing partial foot process effacement (black arrows) (bar = 2 μm). A magnified EM image (right) of podocytes of 6 dpf ctns−/− larva showing narrowed podocyte slit diaphragmatic spaces (white arrows) (bar = 1 μm). (h) Quantitation of podocyte foot process width (FPW) in cut sections at the level of the glomerulus in both genotypes. bb, brush border; bs, Bowman’s space; g, glomerulus; n, nucleus; pt, proximal tubule. *P < 0.05, ***P < 0.001 between the 2 genotypes using student’s t test. |
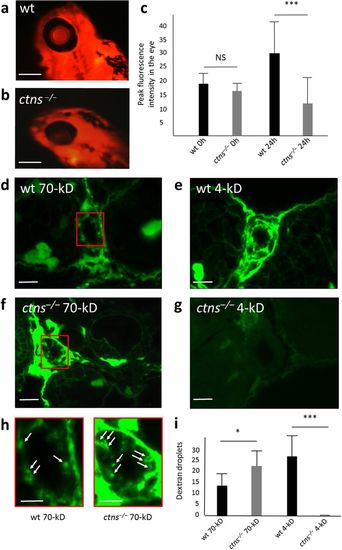
(a–c) Eye fluorescence assay: peak fluorescence intensity in the retinal vascular bed of ctns−/− zebrafish larvae and wild-type larvae (N = 20 each). Fluorescence intensities were evaluated using fixed diameter circles by the ImageJ software. (a) A representative wild-type 4 dpf larva (24 h post-injection) (bar = 200 μm). (b) A representative ctns−/− 4 pdf larva (24 h post-injection) (bar = 200 μm). (c) Quantitation of peak fluorescence intensities in the retinal vascular bed of both genotypes. (d–i) Histopathological functional evaluation: (d) A representative proximal tubule of wt larva injected with the 70-kDa labelled dextran (bar = 10 μm). (e) A representative proximal tubule of wt larva injected with the 4-kDa labelled dextran (bar = 10 μm). (f) A representative proximal tubule of ctns−/− larva injected with the 70-kDa labelled dextran (bar = 10 μm). (g) A representative proximal tubule of ctns−/− larva injected with the 4-kDa labelled dextran (bar = 10 μm). (h) A higher magnification of the proximal tubules of both genotypes showing internalized 70-kDa dextran within cytosolic puncta that likely correspond to endocytic compartments (marked areas in panels d and f) (bars = 5 μm). (i) Quantitation of the number of dextran puncta in both high and low molecular weight dextran injections in both genotypes (N = 10 for each genotype and each condition). *P < 0.05, ***P < 0.001. PHENOTYPE:
|
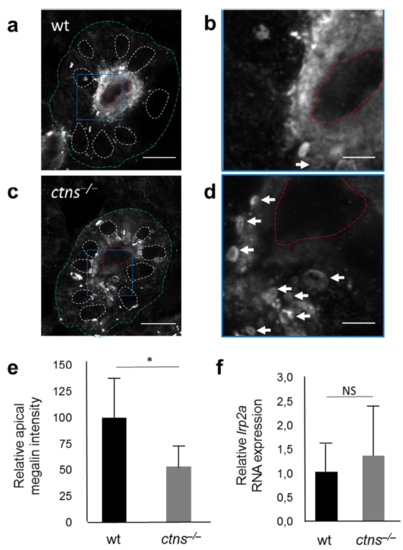
(a) Transverse fluorescent image of the proximal pronephric region of wt 5 dpf larva labelled with anti-megalin antibody (bar = 10 μm). (b) Higher magnification image of wt proximal tubule (square in panel a) showing mainly the diffuse distribution of megalin at the cellular brush border (bar = 3 μm). (c) The proximal pronephric region of ctns−/− 5 dpf larva labelled with anti-megalin antibody (bar = 10 μm). (d) Higher magnification image of ctns−/− proximal tubule (square in panel c) showing majority of megalin staining in sub-apical intracytoplasmic vacuoles (white arrows) (bar = 3 μm). Outer boundaries of proximal tubules were delineated with green, lumen with red, and nuclear boundaries were delineated with white. (e) Quantitation of megalin protein abundance in proximal tubules of wt and ctns−/− larvae (N = 5 for each genotype). (f) Quantitation of the megalin encoding lrp2a RNA expression in homogenized larvae of 6 dpf wt vs ctns−/− larvae (N = 5 individually separated RNA samples for each genotype). *P < 0.05. |
|
ZFIN is incorporating published figure images and captions as part of an ongoing project. Figures from some publications have not yet been curated, or are not available for display because of copyright restrictions. PHENOTYPE:
|
|
ZFIN is incorporating published figure images and captions as part of an ongoing project. Figures from some publications have not yet been curated, or are not available for display because of copyright restrictions. |
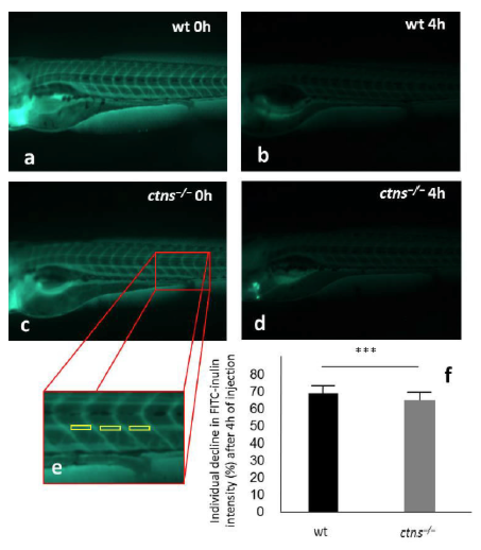
Evaluation of glomerular filtration rate. FITC-inulin was injected into 96 hpf wt and ctns‒/‒ larvae (N=45 and 43, respectively). The fluorescence intensities over the caudal artery were evaluated using ImageJ software at zero and 4h after injection and the percentage of fluorescence decline were calculated separately for each larva. (a) A representative wt larva at 0h post-injection. (b) A representative wt larva at 4h post-injection. (c) A representative ctns‒/‒ larva at 0h post-injection. (d) A representative ctns‒/‒ larva at 4h post-injection. (e) A magnified image showing the exact anatomical positions over the somites 14, 15 and 16 for measuring fluorescence intensities by the ImageJ software. (f) Quantitation of the percentage of fluorescence intensity decline (mean ± SD) after 4h of injection. |