
|
Fig. 4
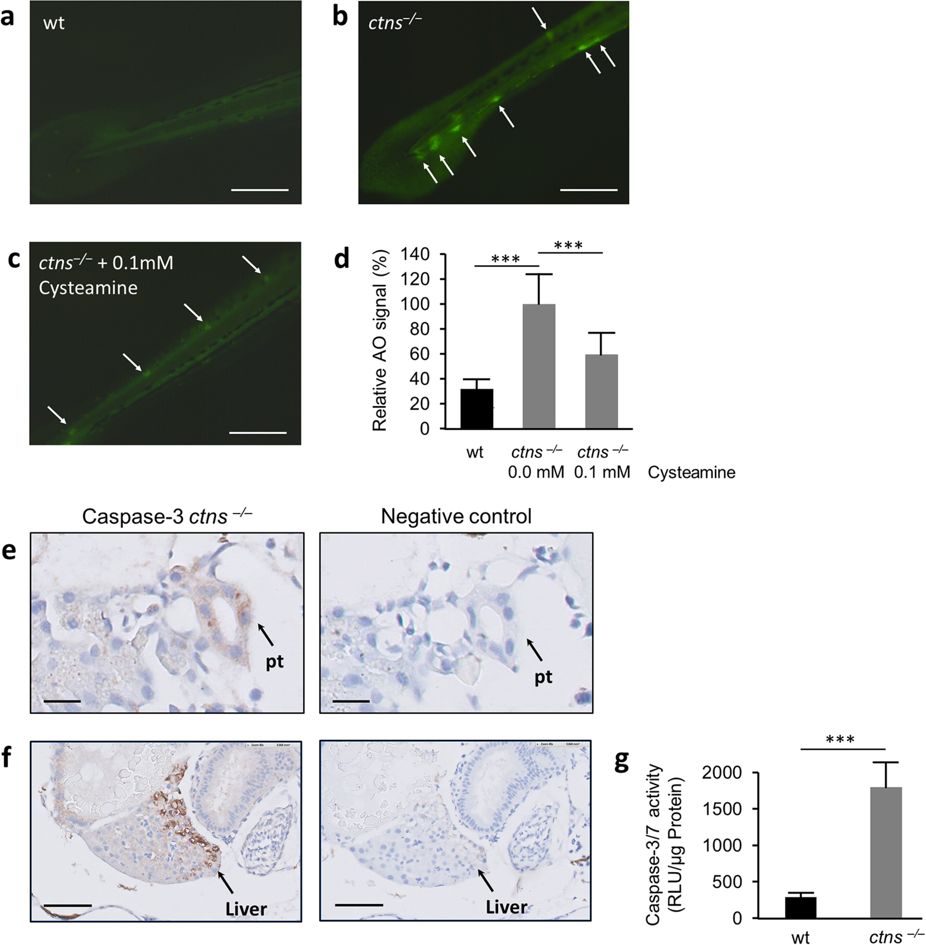
(a–d) Acridine orange: Five dpf wt larvae and ctns−/− larvae, naïve to treatment or treated with 0.1 mM of cysteamine (N = 10 for each group), were incubated with Acridine Orange (AO). Fluorescent spots (white arrows) were delineated in high magnification mode and quantified by ImageJ software. (a) A representative tail segment of 5 dpf wt larva (bar = 200 μm). (b) A representative tail segment of 5 dpf ctns−/− untreated larva (bar = 200 μm). (c) A representative tail segment of 5 dpf ctns−/− larva treated with 0.1 mM cysteamine (bar = 200 μm). (d) Quantitation of the relative fluorescence intensity of apoptotic spots. Average intensity of untreated ctns−/− larvae was set at 100%. *** P < 0.001 against untreated ctns−/− larvae. (e,f) Caspase-3 immunohistochemistry. (e) Representative images showing increased apoptotic signal over the proximal tubule in 5 dpf ctns−/− larva (left) compared to the negative control (right), bar = 10 μm. pt, proximal tubule. (f) Representative images showing increased apoptotic signal over the liver in 5 dpf ctns−/− larva (left) compared to the negative control (right), bar = 30 μm. Rabbit serum was used for the negative control sections instead of 1ry Ab. (g) Caspase-3/7 enzyme activity. Quantitation of Caspase-3/7 enzyme activity by a luciferase based assay in the homogenates of 5 dpf wt and ctns‒/‒ larvae (On average 60 larvae over 3 separate homogenates for each genotype were used). Results were expressed in luminescence units (RLU)/μg protein of each homogenate. ***P < 0.001.