
- Title
-
Transcriptomic, proteomic, and metabolomic landscape of positional memory in the caudal fin of zebrafish
- Authors
- Rabinowitz, J.S., Robitaille, A.M., Wang, Y., Ray, C.A., Thummel, R., Gu, H., Djukovic, D., Raftery, D., Berndt, J.D., Moon, R.T.
- Source
- Full text @ Proc. Natl. Acad. Sci. USA
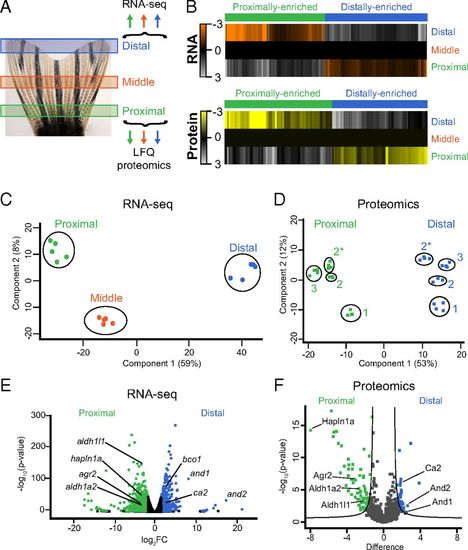
Transcriptomic and proteomic mapping of positional information in uninjured caudal fins. (A) Illustration of the three regions of the fin that were harvested for RNA-seq or LFQ proteomics (see also Fig. S1). (B) Heat maps of 566 transcripts or 238 proteins with proximally enriched (green) or distally enriched (blue) gradients. Each transcript was differentially expressed (FDR < 1%) between each region, and in the same direction across regions. The transcript values shown are the average RPM from all biological replicates, normalized to the middle region, and then log2 transformed. The average protein abundance from all technical replicates is shown as log2 abundance normalized to the middle region. All protein values for the heat map are derived from experiment 3 only (Fig. S1). Each protein was differentially expressed (FDR < 5%) between proximal and distal regions (see Dataset S21 description for more details). (C and D) PCA for RNA-seq (C) or proteomics (D) data. In C, the points represent biological replicates. In D, the points represent technical replicates from different experiments (indicated by numbers 1, 2, and 3). Experiments 2 and 2* are samples from the same group of fish analyzed on different mass spectrometers. (E and F) Volcano plots showing the relative abundances of transcripts (E) or proteins (F). Transcripts were considered differentially expressed at FDR < 1% and fold change > 3 between proximal and distal regions, whereas proteins were considered differentially expressed at FDR < 5%. Selected transcripts and proteins are highlighted with the gene or protein name. |

Aldh1l1 and Ca2 abundance in WT and mutant fins. (A) Graphs of the relative abundance of aldh1l1 and ca2 transcripts in proximal compared with distal regions of uninjured fins determined by RT-qPCR. Data are normalized to the abundance of actb2 transcripts. Data are mean ± SEM of n = 6 experiments for aldh1l1 and n = 3 for ca2, with >8 fish per experiment. (B and C) Representative Western blots showing Aldh1l1 and Ca2 protein in the proximal (P), middle (M), and distal (D) regions of uninjured caudal fins (B) and uninjured pectoral and dorsal fins (C). Actb2 was used as a loading control. (D) Representative images of sof and lof uninjured caudal fins, with Western blots showing Aldh1l1 and Ca2 protein in the proximal (P), middle (M), and distal (D) regions of these mutant fins. |
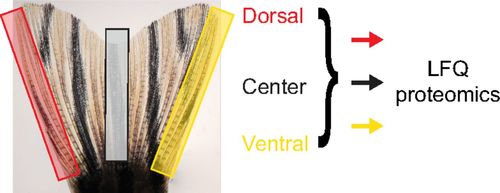
Representative caudal fin showing regions harvested for dorsal, central, and ventral proteomics. |