
|
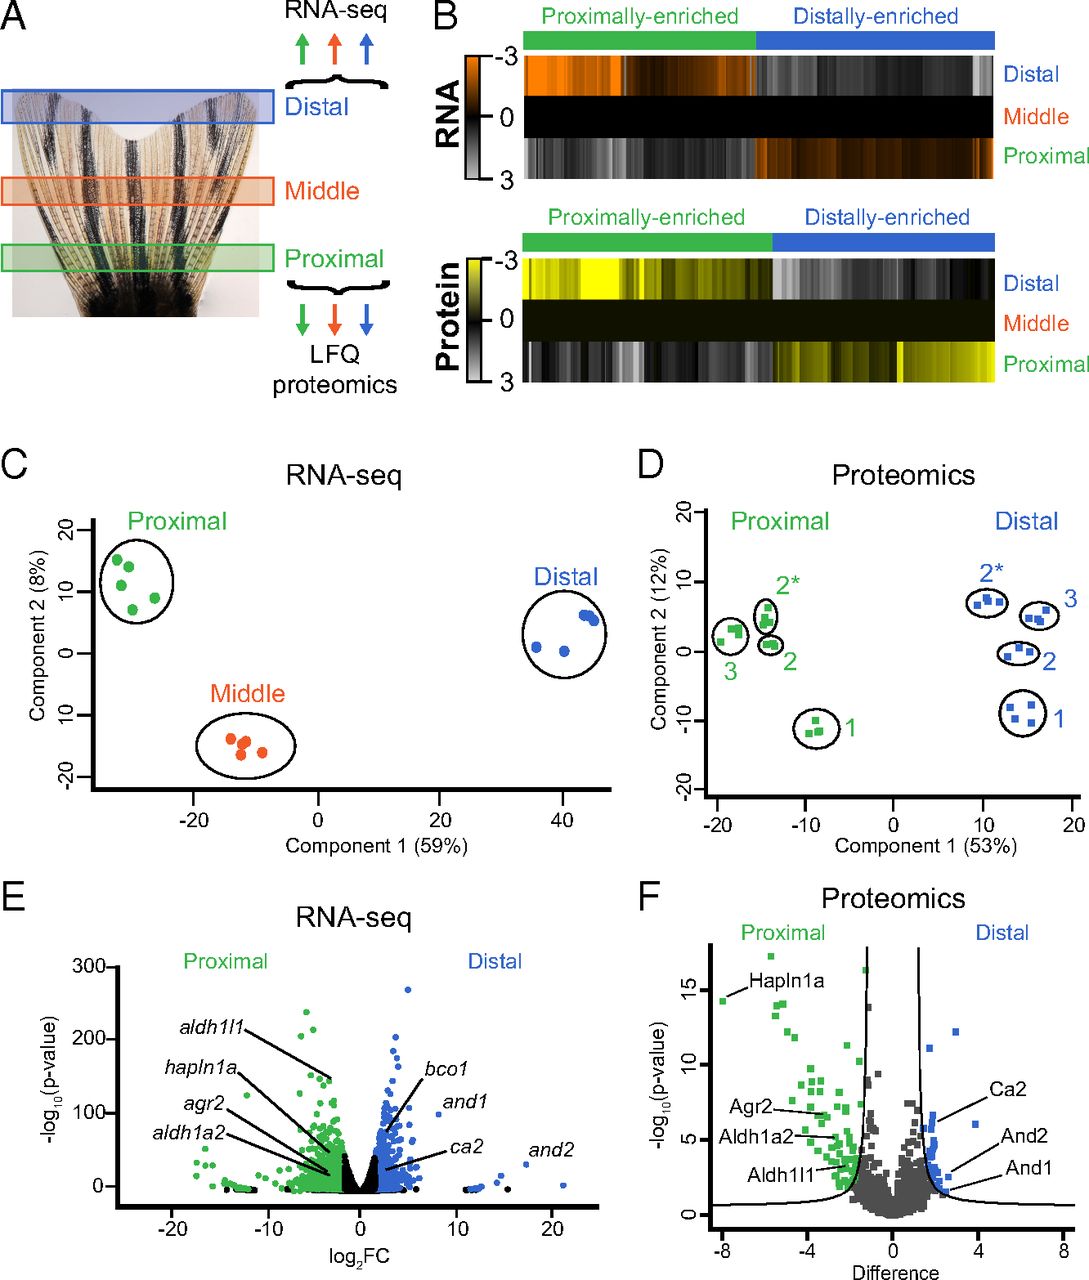
Fig. 1
Transcriptomic and proteomic mapping of positional information in uninjured caudal fins. (A) Illustration of the three regions of the fin that were harvested for RNA-seq or LFQ proteomics (see also Fig. S1). (B) Heat maps of 566 transcripts or 238 proteins with proximally enriched (green) or distally enriched (blue) gradients. Each transcript was differentially expressed (FDR < 1%) between each region, and in the same direction across regions. The transcript values shown are the average RPM from all biological replicates, normalized to the middle region, and then log2 transformed. The average protein abundance from all technical replicates is shown as log2 abundance normalized to the middle region. All protein values for the heat map are derived from experiment 3 only (Fig. S1). Each protein was differentially expressed (FDR < 5%) between proximal and distal regions (see Dataset S21 description for more details). (C and D) PCA for RNA-seq (C) or proteomics (D) data. In C, the points represent biological replicates. In D, the points represent technical replicates from different experiments (indicated by numbers 1, 2, and 3). Experiments 2 and 2* are samples from the same group of fish analyzed on different mass spectrometers. (E and F) Volcano plots showing the relative abundances of transcripts (E) or proteins (F). Transcripts were considered differentially expressed at FDR < 1% and fold change > 3 between proximal and distal regions, whereas proteins were considered differentially expressed at FDR < 5%. Selected transcripts and proteins are highlighted with the gene or protein name.