
- Title
-
Myogenic regulatory transcription factors regulate growth in rhabdomyosarcoma
- Authors
- Tenente, I.M., Hayes, M.N., Ignatius, M.S., McCarthy, K., Yohe, M., Sindiri, S., Gryder, B., Oliveira, M.L., Ramakrishnan, A., Tang, Q., Chen, E.Y., Petur Nielsen, G., Khan, J., Langenau, D.M.
- Source
- Full text @ Elife
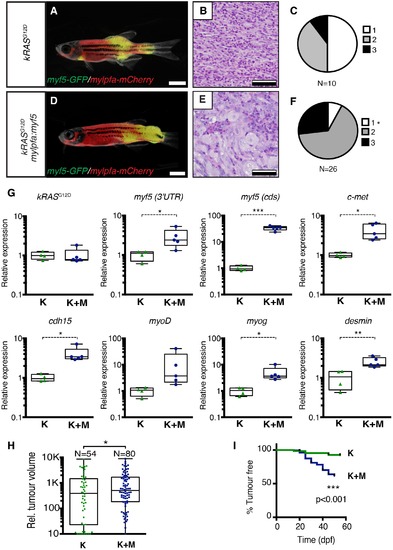
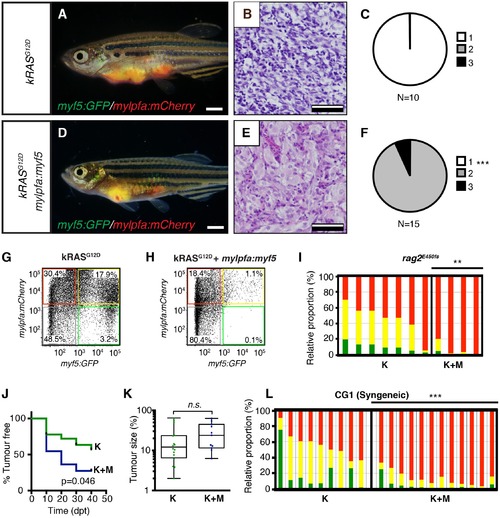
Transgenic myf5 elevates tumor cell differentiation, increases tumor size, and accelerates time to primary tumor-onset when expressed in myosin-expressing ERMS cells. (A–F) Primary ERMS developing in myf5:GFP/mylpfa:mCherry AB-strain zebrafish. Transgenic kRASG12D-expressing ERMS (A–C) compared with those that express both kRASG12Dand mylpfa:myf5 (D–F). Animals imaged at 35 dpf (A,D). Hematoxylin and Eosin-stained sections of representative tumors (B,E) and quantification of differentiation within individual tumors (C,F; 1-less differentiated and 3-most differentiated). Asterisk denotes p=0.015 by Chi-square test. (G) Quantitative real-time PCR gene expression performed on bulk ERMS cells, confirming high myf5 expression, increased differentiation, and high expression of TPC associated genes in ERMS that co-express kRASG12Dand mylpfa:myf5 (K+M, N = 5). Endogenous myf5 was assessed using primers specific to the 3’UTR and total myf5 assessed by primers that amplify the coding sequence (cds). cadherin 15 (cdh15) and myogenin (myog). kRASG12D alone expressing ERMS (K, N = 4). Average gene expression with 50% confidence intervals denoted by box. Mean, maximum, and minimum also denoted. (H) Relative tumor size of primary ERMS at 30 days post fertilization (dpf). Box shows 50% confidence interval. Mean, maximum, and minimum denoted. Asterisk denotes p=0.0108, Student’s t-test. (I) Kaplan-Meijer analysis denoting time-to-tumor onset (p<0.001, Log-rank Statistic, N = 494 fish analyzed for K and N = 470 for K+M). Scale bars equal 2 mm (A,D) and 50 μm (B,E). Asterisks in panels G-H denote *p<0.05; **p<0.01; ***p<0.001 by Student’s t-test. |
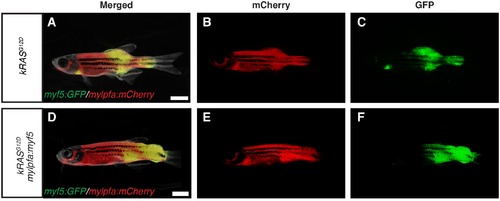
Fluorescence images of primary ERMS developing in stable transgenic myf5:GFP/mylpfa:mCherry zebrafish. Images of the same representative rag2:kRASG12D –alone (A–C) and rag2:kRASG12D; mylpfa:myf5 (D–F) zebrafish shown in Figure 1A and D, respectively. (A,D) merged (brightfield, GFP and mCherry) image. (B,E) mCherry image. (C,F) GFP image. Scale bars equal 2 mm. |
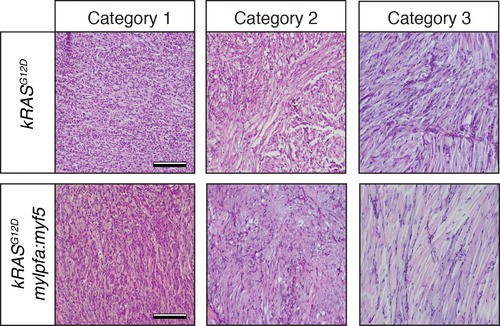
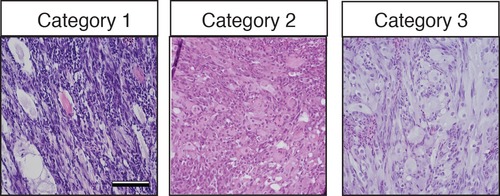
Histological classification of primary zebrafish ERMS based on differentiation score. Representative H and E-stained sections of zebrafish ERMS assigned to each differentiation category. Scale bars equal 100 μm. |
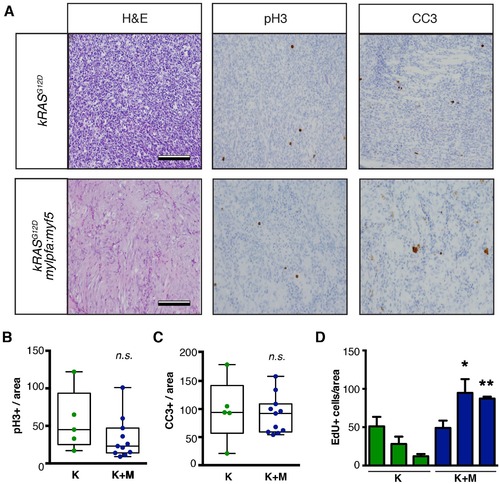
Analysis of proliferation and apoptosis in zebrafish primary ERMS. (A) Representative H and E-stained sections and immunohistochemistry for phospho-H3 (pH3) and cleaved caspase-3 (CC3). (B) Quantification of the total number of pH3-positive cells per 400x imaging field. (n=average of 3 fields/tumor section). (C) Quantification of the total number of CC3-positive cells per 400x imaging field (n=average of 3 fields/tumor). Boxes in B–C denote 50% confidence interval and mean, maximum, and minimum shown. kRASG12D[K] (N = 5) and kRASG12D; mylpfa:myf5 [K+M] (N = 11). (D) Quantification of total number of EdU+ cells per area (n=average of 3 fields/tumor. N = 3 tumors per genotype). *p<0.05 or **p<0.01 in comparison to each kRASG12D-alone expressing ERMS (Student’s t-test). Error bars denote +/- STD. Scale bars equal 100 μm (A). Not significant by Student’s t-test (n.s.). |
Tumors that transgenically express myf5 are fully transformed and retain a differentiated phenotype following engraftment into recipient animals. (A–F) Analysis of ERMS arising in transplanted fish. kRASG12D expressing ERMS arising in rag2E450fs transplant recipient fish (A–C) compared with those that express both kRASG12D and mylpfa:myf5 (D–F). Tumors were created in stable transgenic myf5:GFP/mylpfa:mCherry transgenic, AB-strain zebrafish and imaged following engraftment into recipient fish at 30 days post transplantation (dpt). Hematoxylin and eosin stained sections of representative tumors (B,E) and quantification of differentiation within individual ERMS (C,F; 1-less differentiated and 3-most differentiated). Asterisks denote p<0.001 by Chi-square test. (G,H) Representative flow cytometry analysis of fluorescently-labeled ERMS cells isolated from transplanted rag2E450fs zebrafish. (I) Graphical summary of ERMS cell sub-fractions that grow following engraftment into immune-deficient rag2E450fs recipients. Individual tumors are represented as separate bars with the proportion of G+ (green), G+R+ (yellow) and R+ (red) sub-populations denoted. **p=0.006. (J) Kaplan-Meijer analysis showing time-to-tumor onset in transplanted ERMS arising in rag2E450fs zebrafish (p=0.046, Log-rank Statistic, 2 × 10⁵ cells/fish, N > 12 animals per arm, representing ≥3 independently-arising primary ERMS). (K) Relative tumor size at 30 days post engraftment (same animals analyzed as in J). (L) ERMS cells were also more differentiated following engraftment of myf5:GFP/mylpfa:mCherry ERMS cells into syngeneic recipient fish (p<0.001, Student’s T-test, N ≥ 3 independently arising primary ERMS and assessed in n ≥ 2 animals per transplanted tumor). Scale bars equal 2 mm (A,D) and 50 μm (B,E). |
Histological classification of transplanted zebrafish ERMS based on differentiation score. Representative H and E-stained sections of zebrafish ERMS assigned to each differentiation category. Scale bars equal 100 μm. |
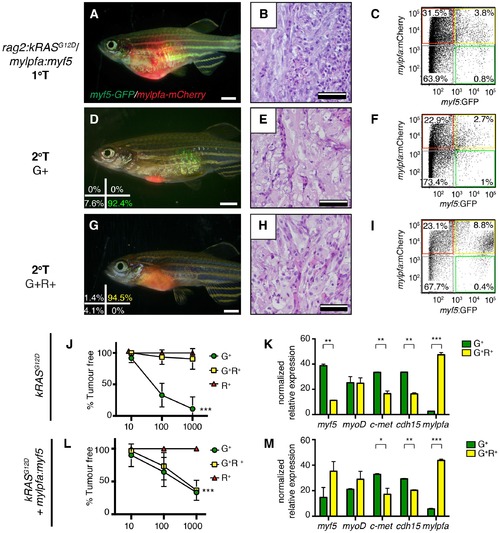
Limiting dilution cell transplantation shows that myf5 can confer tumor-propagating ability to differentiated myf5:GFP+/mylpfa:mCherry+ cells. Tumors were generated in myf5:GFP/mylpfa:mCherry CG1-strain syngeneic zebrafish. Representative tumors arising in primary transplanted fish (1°T, A–C) or secondary transplanted fish following engraftment with highly purified myf5:GFP+, mylpfa:mCherry-negative (2°T G+, D–F) or myf5:GFP+, mylpfa:mCherry+ ERMS cells (2°T G+R+, G–I). Sort purity following FACS is noted in the lower left panels of D and G and was >92% for each population. These cells were used for cell transplantations and data provided in D-I. Cell viability was >95%. (J,L) Graphical summary of tumor engraftment following limiting dilution cell transplantation using highly purified sorted ERMS cells. Data is combined from all tumors shown in Table 1. ***p<0.0002 by ELDA analysis. (K,M) Relative gene expression analysis of sorted G+ or G+R+ ERMS cells from representative kRASG12D (K) or kRASG12D; mylpfa:myf5 (M) expressing ERMS (Standard Deviation, n = 3 technical replicates per PCR condition). *p<0.05; **p<0.01 and ***p<0.001 by Student’s t-test. |
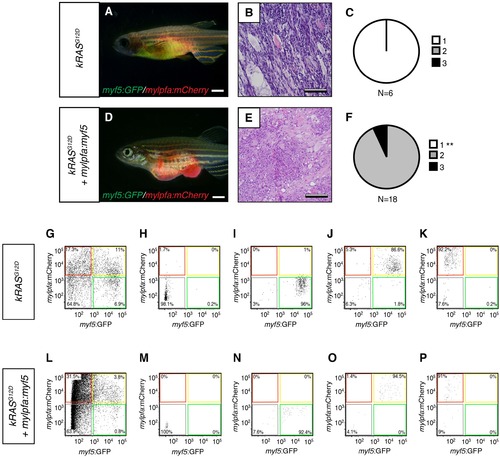
Analysis of transplanted ERMS arising in CG1-strain syngeneic recpients. (A,D) Representative images of transplanted fish. ERMS were created in myf5-GFP/mylpfa-mCherry transgenic, CG1-strain syngeneic zebrafish and imaged following 30 days of engraftment. Genotypes denoted to the left. (B,E) Representative histology of transplanted tumors. (C,F) Quantification of differentiation based on histological review (1-less differentiated and 3-most differentiated). **p<0.01 by Chi-square test. (G–P) Representative examples of sort purity following FACS for cells used in limiting dilution cell transplantation experiments. (G–K) Sort purity following FACS for a representative kRASG12D-alone expressing ERMS and (L–P) kRASG12D+ mylpfa:myf5 expressing ERMS (data is reproduced in lower left panels of Figure 3D and G). Scale bars equal 2 mm (A,D) and 100 μm (B,E). |