
|
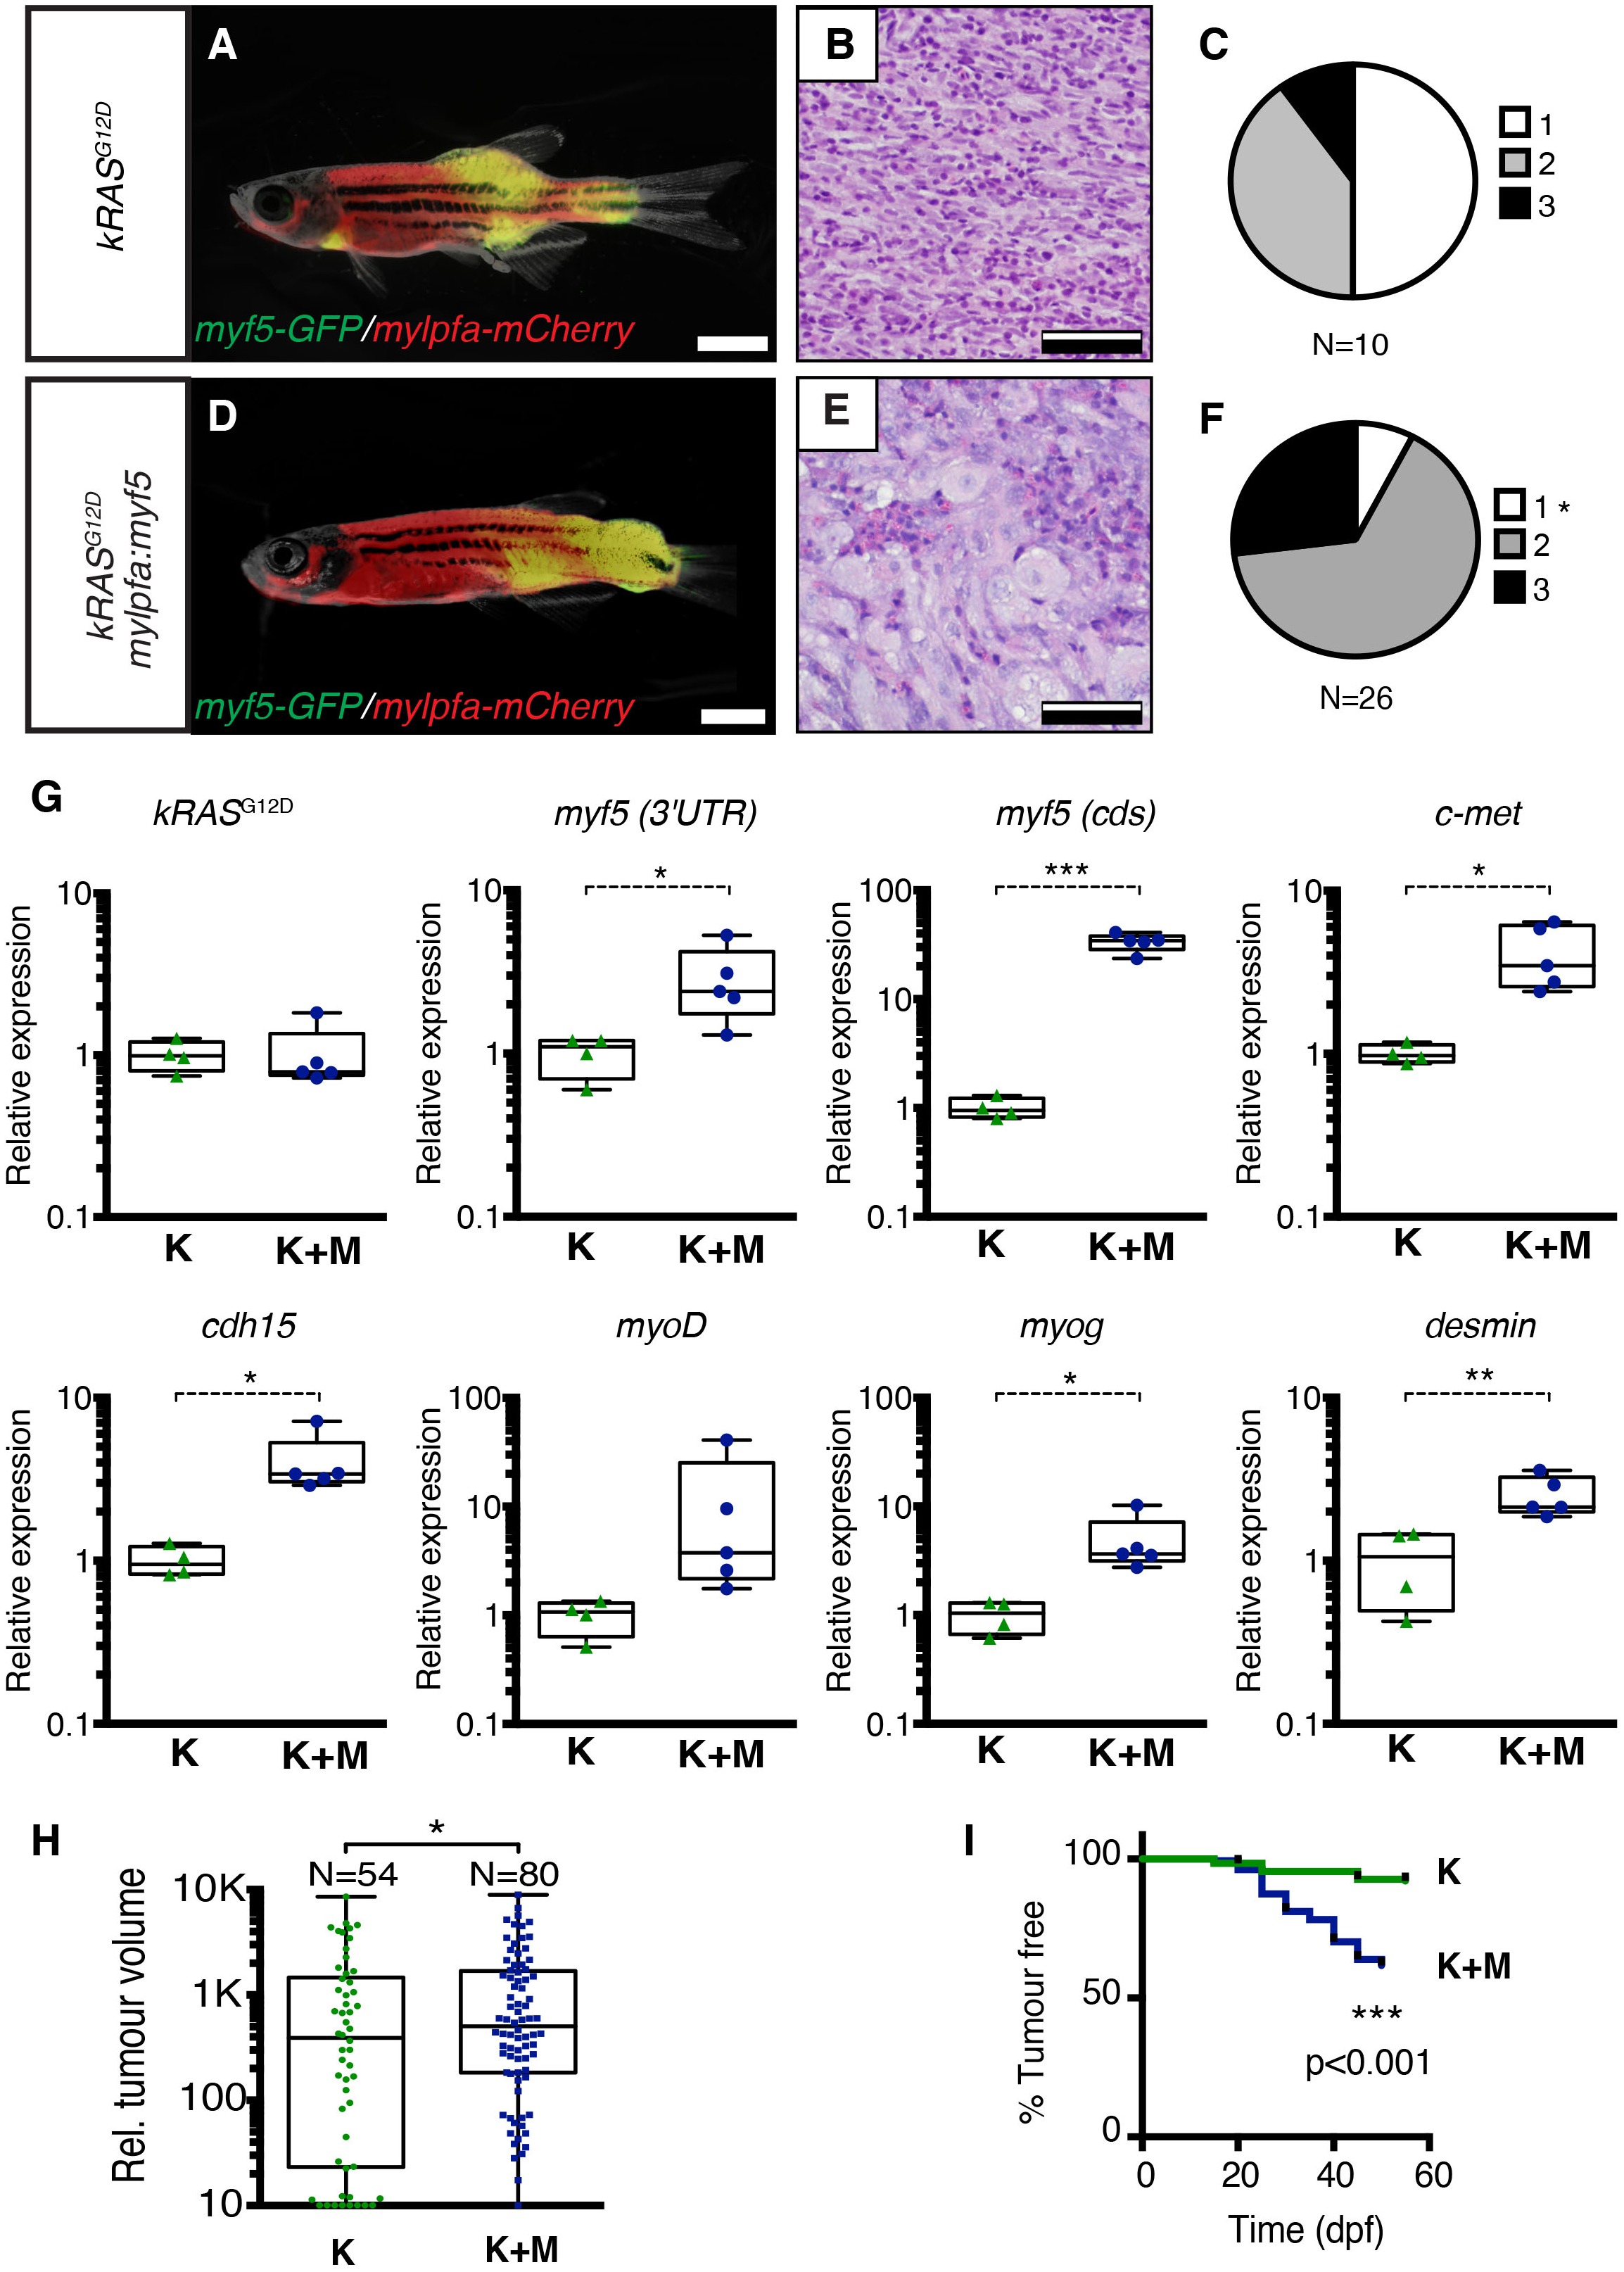
Fig. 1
Transgenic myf5 elevates tumor cell differentiation, increases tumor size, and accelerates time to primary tumor-onset when expressed in myosin-expressing ERMS cells.
(A–F) Primary ERMS developing in myf5:GFP/mylpfa:mCherry AB-strain zebrafish. Transgenic kRASG12D-expressing ERMS (A–C) compared with those that express both kRASG12Dand mylpfa:myf5 (D–F). Animals imaged at 35 dpf (A,D). Hematoxylin and Eosin-stained sections of representative tumors (B,E) and quantification of differentiation within individual tumors (C,F; 1-less differentiated and 3-most differentiated). Asterisk denotes p=0.015 by Chi-square test. (G) Quantitative real-time PCR gene expression performed on bulk ERMS cells, confirming high myf5 expression, increased differentiation, and high expression of TPC associated genes in ERMS that co-express kRASG12Dand mylpfa:myf5 (K+M, N = 5). Endogenous myf5 was assessed using primers specific to the 3’UTR and total myf5 assessed by primers that amplify the coding sequence (cds). cadherin 15 (cdh15) and myogenin (myog). kRASG12D alone expressing ERMS (K, N = 4). Average gene expression with 50% confidence intervals denoted by box. Mean, maximum, and minimum also denoted. (H) Relative tumor size of primary ERMS at 30 days post fertilization (dpf). Box shows 50% confidence interval. Mean, maximum, and minimum denoted. Asterisk denotes p=0.0108, Student’s t-test. (I) Kaplan-Meijer analysis denoting time-to-tumor onset (p<0.001, Log-rank Statistic, N = 494 fish analyzed for K and N = 470 for K+M). Scale bars equal 2 mm (A,D) and 50 μm (B,E). Asterisks in panels G-H denote *p<0.05; **p<0.01; ***p<0.001 by Student’s t-test.