
- Title
-
Standardized echocardiographic assessment of cardiac function in normal adult zebrafish and heart disease models
- Authors
- Wang, L.W., Huttner, I.G., Santiago, C.F., Kesteven, S.H., Yu, Z.Y., Feneley, M.P., Fatkin, D.
- Source
- Full text @ Dis. Model. Mech.
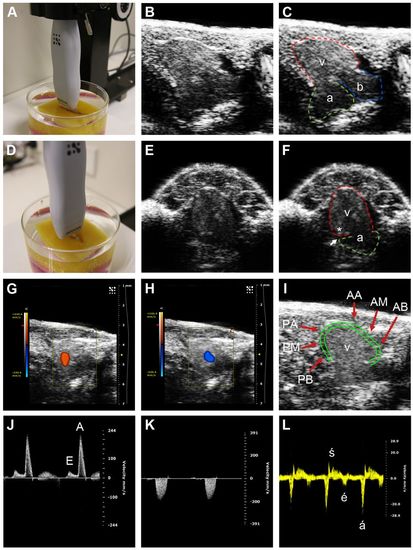
Zebrafish echocardiographic imaging. (A) Transducer position for the longitudinal axis (LAX) view. (B,C) LAX images, with ventricle (v, red tracing denotes epicardium), atrium (a, green tracing) and bulbus arteriosus (b, blue tracing) indicated in C. (D) Transducer position for the short axis (SAX) view. (E,F) SAX images, with ventricle and atrium indicated in F. The ventricle joins the atrium at the atrioventricular annulus, with the atrioventricular groove (white arrow) overlying this area. An asterisk labels the area of myocardium immediately adjacent to atrioventricular annulus which is the site of tissue Doppler interrogation. (G,H) Color Doppler in the LAX view showing (G) ventricular inflow (orange) from the atrium during ventricular diastole, and (H) ventricular outflow (blue) to the bulbus arteriosus during ventricular systole. (I) Ventricular wall motion was analyzed in six segments: AA, anterior (ventral) apex; AM, anterior mid; AB, anterior base; PA, posterior (dorsal) apex; PM, posterior mid; PB, posterior base. The epicardium (outer green border) and the inner border of the compact myocardium (inner green border) of the ventricle are shown. (J) Pulsed-wave Doppler interrogation of atrioventricular inflow at the level of the atrioventricular valve, showing the E (early diastolic) and A (atrial systolic) waves. (K) Pulsed-wave Doppler interrogation of ventricular outflow. (L) Tissue Doppler interrogation of the atrioventricular annulus demonstrating the é (early diastolic), á (atrial systolic) and ś (ventricular systolic) waves. |
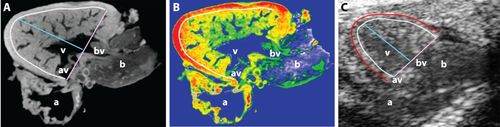
Localization of anatomical landmarks in the zebrafish heart. (A) Representative optical section from a three-dimensional micro-computed tomography reconstruction of a wild-type, adult zebrafish heart (Skyscan 1072, ZEISS XRadia, Belgium). (B) False-colored heat map of the section shown in A demonstrating differing densities within the ventricular myocardium. The outer compact layer possesses greater density (red) in comparison with the highly trabeculated, non-compact spongy myocardium (yellow/green). (C) Representative high-frequency echocardiography B-mode image. In all three panels, the white border demarcates the interface between the compact and non-compact layers of the myocardium. The red border in C demarcates the outer layer of the epicardium. Pink line, basal diameter (DBASE), the distance between anterior and posterior borders of compact myocardium; blue line, perpendicular longitudinal diameter (DLONG) between ventricular base to apical compact myocardial border. a, atrium; av, atrioventricular valve; b, bulbus arteriosus; bv, bulboventricular valve; v, ventricle. |
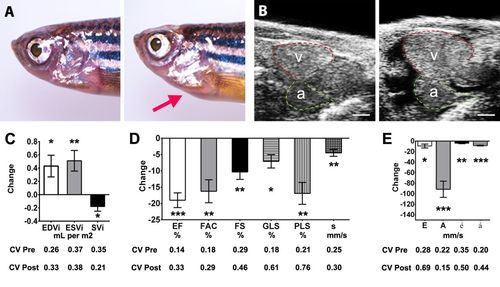
Diphtheria toxin A (DTA) myocarditis model. Serial echocardiography was performed in male wild-type fish (n=8) to assess the effects of conditional cardiomyocyte-specific expression of DTA by 4-hydroxy-tamoxifen (4-HT) exposure. (A) Macroscopic appearance before (left) and 7 days after (right) 4-HT exposure. Treated fish show ventral protrusion (arrow) associated with pericardial effusion and cardiac chamber enlargement. (B) Echocardiographic longitudinal axis images showing ventricle (v, outlined in red) and atrium (a, outlined in green) before (left) and after (right) 4-HT exposure. Scale bar: 0.2 mm. (C) Bar graph depicting mean absolute change in end-diastolic volume indexed to BSA (EDVi), end-systolic volume indexed to BSA (ESVi) and stroke volume indexed to BSA (SVi). (D) Bar graph depicting the mean absolute change from baseline for indices of systolic function: ejection fraction (EF), fractional area change (FAC), fractional shortening (FS), global longitudinal strain (GLS), peak longitudinal strain (PLS) and peak ś wave velocity on tissue Doppler. (E) Bar graph depicting mean absolute change in parameters of diastolic function: peak E wave, A wave, é wave and á wave velocities. For parameters shown in C-E, the coefficient of variation (CV, where CV=s.d./mean) was calculated for pre-treatment and post-treatment measurements. Data are shown as mean±s.e.m. *P≤0.05; **P≤0.01; ***P≤0.001, paired t-test. PHENOTYPE:
|
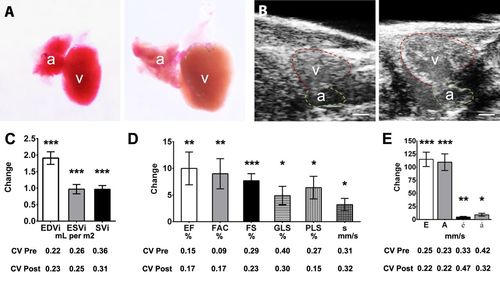
Chronic anemia model. Serial echocardiography was performed in male wild-type fish (n=8) to assess cardiac function before and after an 18-day phenylhydrazine hydrochloride (PHZ) treatment protocol to induce hemolytic anemia. (A) Representative explanted hearts from an untreated fish (left) and a fish treated with PHZ (right); treated hearts developed pallor and enlargement of the ventricle (v) and atrium (a). (B) Longitudinal axis images showing ventricular and atrial size before (left) and after (right) PHZ. Scale bar: 0.2 mm. (C-E) Description of bar graphs depicted in C-E as for Fig. 5. Data are shown as mean±s.e.m. *P≤0.05, **P≤0.01; ***P≤0.001 (paired t-test). PHENOTYPE:
|