
- Title
-
A conserved bacterial protein induces pancreatic beta cell expansion during zebrafish development
- Authors
- Hill, J.H., Franzosa, E.A., Huttenhower, C., Guillemin, K.
- Source
- Full text @ Elife
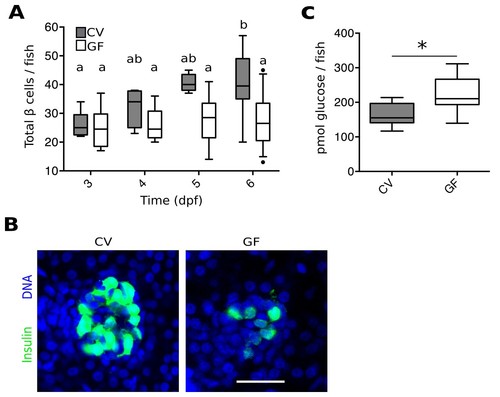
The microbiota are required for normal expansion of the larval β cell mass. (A) Total number of β cells per larva in GF (white box plots) and CV (grey box plots) fish at 3, 4, 5 and 6 dpf. In this, and in all subsequent figures, CV data are shown in grey box plots, and GF data, or statistically similar treatment groups, are shown in white box plots. In all relevant panels and remaining figures, box plot whiskers represent the 95% confidence interval of the data set. Single factor ANOVA indicates that gnotobiology of the fish was significant in determining the number of β cells present (F7=9.01, p=1.45e−8). Labels a, ab and b indicate the results of post hoc means testing (Tukey). The difference between GF and CV cell counts became significant at 6 dpf (t=−5.91, p<0.001). (B) Representative 2D slices from confocal scans through the primary islets of 6 dpf CV and GF Tg(-1.0insulin:eGFP) larvae. Each slice is taken from the approximate center of the islet structure. Insulin promoter expressing β cells are in green and nuclei are blue. Scale bar = 40 μM. (C) The average amount of glucose (pmol) per larva aged 6 dpf (* t17=−3.65, p<0.01). EXPRESSION / LABELING:
PHENOTYPE:
|

ZFIN is incorporating published figure images and captions as part of an ongoing project. Figures from some publications have not yet been curated, or are not available for display because of copyright restrictions. PHENOTYPE:
|
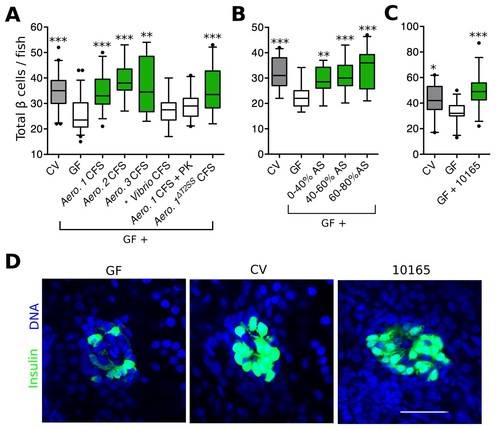
Aeromonas secretes a factor that rescues normal expansion of the GF β cell mass. (A) Total β cell numbers in GF, CV and GF fish treated at 4 dpf with different cell free supernatant (CFS) samples. 'Aero.' refers to bacteria of the genus Aeromonas, with each number (1, 2, 3) denoting a separate species. '+ PK' indicates proteinase K addition to the CFS sample prior to treatment. *p<0.05, **p<0.01, ***p<0.001: Denotes treatment that is significantly different than GF by Tukey analysis. (B) Total β cell numbers in CV, GF and GF fish treated at 4 dpf with separate ammonium sulfate fractions (% AS) prepared from the Aeromonas 1ΔT2SS CFS. Note that the 60–80% ammonium sulfate fraction resulted in the greatest increase in β cell numbers. (C) Total β cells in GF, CV and GF fish treated with purified protein. 10165 represents purified protein from the M001_10165 locus. (D) Representative 2D slices from confocal scans through the primary islets of GF, CV and 10165 protein treated Tg(-1.0insulin:eGFP) 6 dpf larvae. Insulin promoter expressing β cells are shown in green and nuclei are blue. Scale bar = 40 μM. |
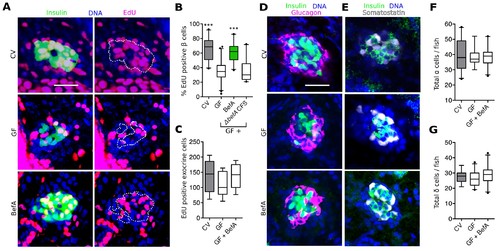
BefA facilitates β cell mass expansion through proliferation. (A, D & E) Representative 2D slices from confocal scans through the primary islets of GF, CV and BefA (10165) protein treated 6 dpf larvae. Scale bars = 40 μM. (A) Insulin promoter expressing β cells are shown in green, all nuclei are blue, and EdU containing nuclei are magenta. Left hand panels are a merge of all three markers. For ease of resolving cells that are double positive for both insulin and EdU, the right hand panels show the location of insulin outlined by white dashed lines. (B) Percentage of EdU positive β cells in CV, GF or GF treated with either purified BefA or CFS from A. veroniiΔbefA cultures (△befA CFS). ***p<0.001: Denotes treatment that is significantly different than GF by Tukey analysis. (C) Total EdU positive exocrine cells quantified from the approximate central longitudinal plane of the pancreas in each fish. (D) Insulin promoter expressing β cells are shown in green, all nuclei are blue, and α cells, stained with anti-glucagon antibody are magenta. (E) Somatostatin promoter expressing δ cells are shown in white, all nuclei are blue, and β cells stained with anti-insulin antibody are outlined in green. (F) Total α cells in GF, CV and GF fish treated with BefA. (G) Total δ cells in GF, CV and GF fish treated with BefA. |