
|
Fig. 1
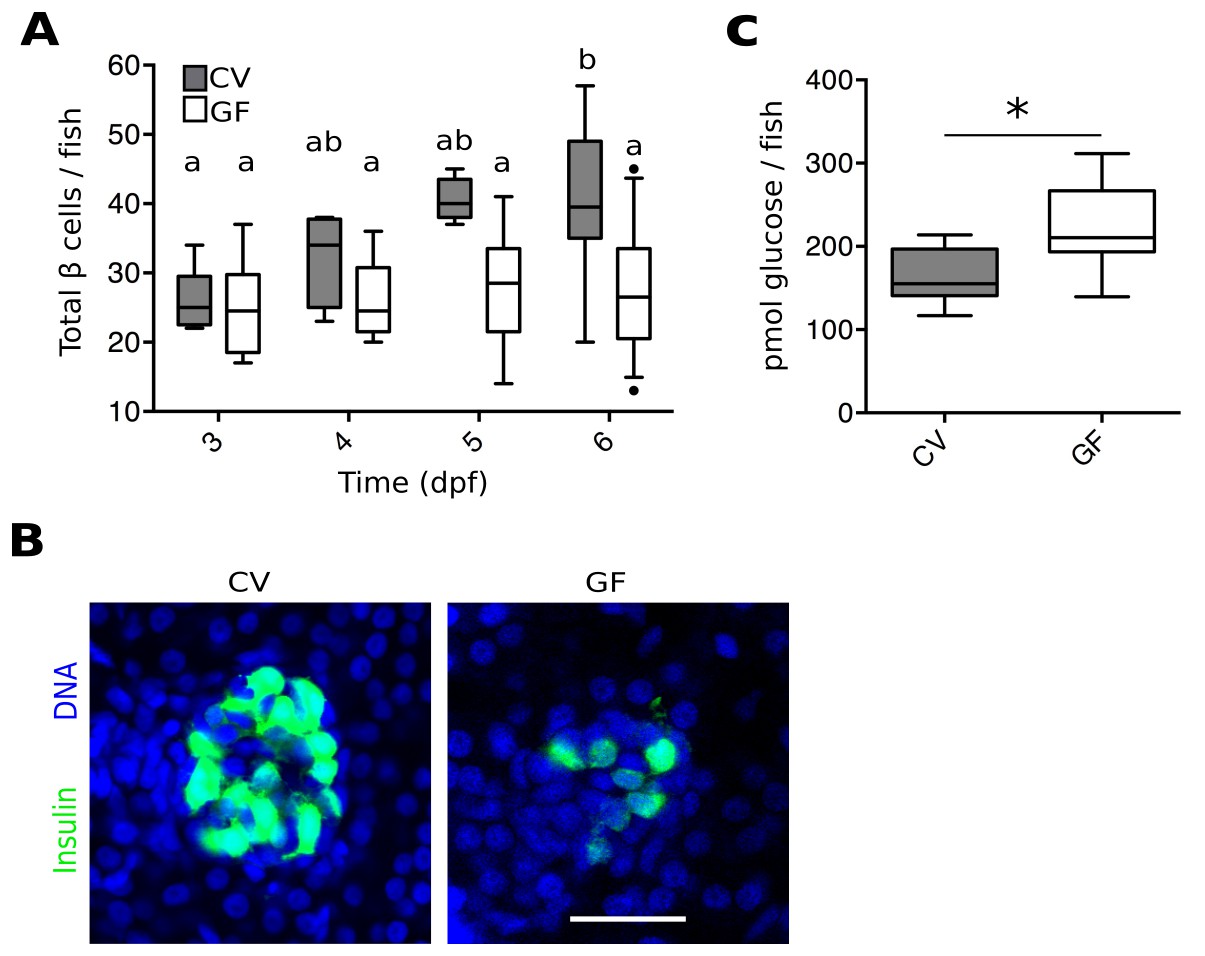
The microbiota are required for normal expansion of the larval β cell mass.
(A) Total number of β cells per larva in GF (white box plots) and CV (grey box plots) fish at 3, 4, 5 and 6 dpf. In this, and in all subsequent figures, CV data are shown in grey box plots, and GF data, or statistically similar treatment groups, are shown in white box plots. In all relevant panels and remaining figures, box plot whiskers represent the 95% confidence interval of the data set. Single factor ANOVA indicates that gnotobiology of the fish was significant in determining the number of β cells present (F7=9.01, p=1.45e−8). Labels a, ab and b indicate the results of post hoc means testing (Tukey). The difference between GF and CV cell counts became significant at 6 dpf (t=−5.91, p<0.001). (B) Representative 2D slices from confocal scans through the primary islets of 6 dpf CV and GF Tg(-1.0insulin:eGFP) larvae. Each slice is taken from the approximate center of the islet structure. Insulin promoter expressing β cells are in green and nuclei are blue. Scale bar = 40 μM. (C) The average amount of glucose (pmol) per larva aged 6 dpf (* t17=−3.65, p<0.01).