
- Title
-
Establishment of Infection Models in Zebrafish Larvae (Danio rerio) to Study the Pathogenesis of Aeromonas hydrophila
- Authors
- Saraceni, P.R., Romero, A., Figueras, A., Novoa, B.
- Source
- Full text @ Front Microbiol
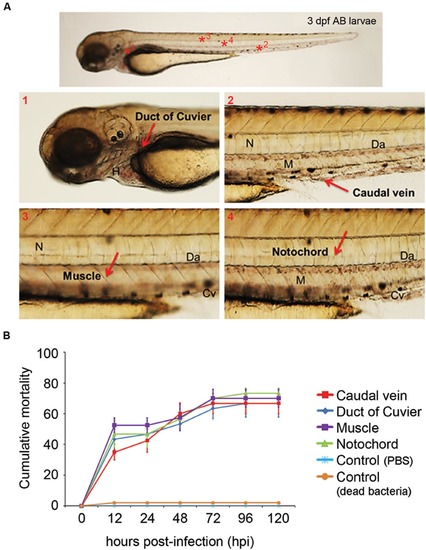
(A) Anatomical distribution of the selected sites for microinjection. The duct of Cuvier (A1) and the caudal vein (A2) were selected to establish systemic infections. Injection in the muscle (A3) or notochord (A4) induced a local infection. Cv, caudal vein; Da, dorsal aorta; M, muscle; N, notochord. (B) Evolution of cumulative mortality in larvae infected with 1 nL of an A. hydrophila solution (3200 CFU/nL). The graph shows a representative result of the three independent experiments conducted. Forty larvae were injected in each anatomical site. No significant differences were observed between the mortality registered using the different injection sites throughout the experiment. |
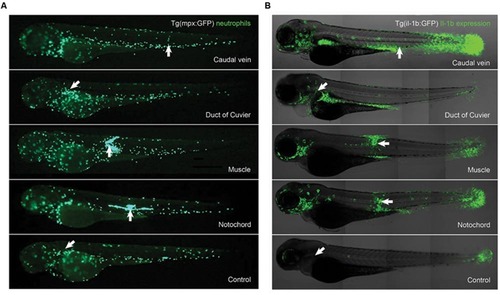
(A) In vivo imaging of neutrophil migration after infection of Tg(mpx:GFP+/+) larvae with A. hydrophila. Larvae were injected with 1 nL of A. hydrophila (5600 CFU/nL) and imaged at 6 hpi. Images show differential migration of neutrophils depending on the anatomical site of injection. (B) Anatomical distribution of IL-1β gene expression in larvae microinjected at different anatomical sites. Tg(il-1b:GFP+/+) larvae were injected with 1 nL of A. hydrophila (1400 CFU/nL) and imaged at 6 hpi. Overlay of IL1-β expression (green), with the transmission channel used as an anatomical guide. The white arrows indicate the positions of the injection sites. EXPRESSION / LABELING:
|
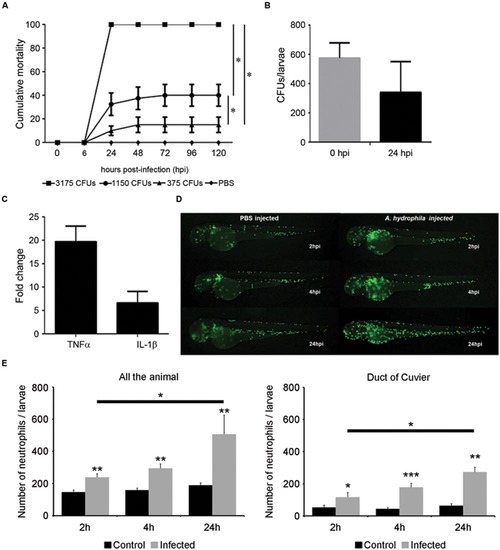
Infection model by microinjection in the duct of Cuvier. (A) Cumulative mortality in larvae injected with various doses of bacteria (3175 CFU/nL, 1150 CFU/nL, and 375 CFU/nL). Graph shows a representative experiment of three independent infections (n = 40 larvae per group). The dilution of the bacteria induced a significant decrease of mortality (*P < 0.05). (B) Bacterial burden of infected larvae at 0 and 24 hpi. A representative result (mean ± SEM) of two independent experiments is presented (n = 40 larvae per group). (C) Increased TNFα and IL1-β expression in infected larvae at 6 hpi (n = 30 larvae per group). (D) In vivo response of neutrophils after infection. Tg(mpx:GFP+/+) larvae were injected with A. hydrophila (200 CFU/nL) and imaged at 2, 4, and 24 hpi. (E) Total neutrophil counts in infected and control larvae in all the body (systemic infection) and in duct of Cuvier (local infection). Results represent the mean ± SEM of two independent experiments (n = 10 larvae per group; ANOVA and Tukey HSD test; *P < 0.05, **P < 0.01; ***P < 0.005). EXPRESSION / LABELING:
|
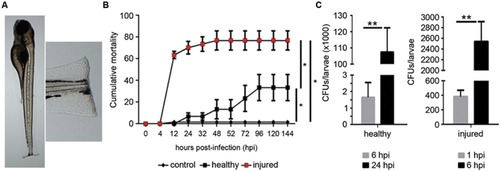
Development of bath infection model. (A) Larvae were injured in the tail fin tip using a sapphire blade. (B) Cumulative mortality of healthy and injured larvae infected with A. hydrophila (108 CFU/mL). Fish in the control group were injured in the tail fin and treated with PBS. Graph is a representative result of five independent experiments using 40 larvae in each experiment. The injury induced a significant increase of mortality (*P < 0.05). (C) Bacterial burden in infected healthy and injured larvae at 1, 6, and 24 hpi. Data represent the mean ± SEM of two independent experiments (n = 40 larvae/each). Significant differences at **P < 0.01. |
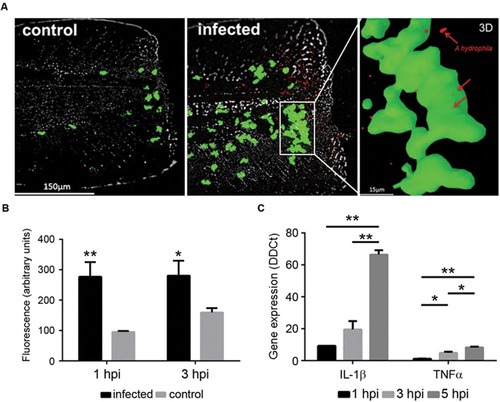
(A) In vivo imaging of neutrophils from Tg(mpx:GFP+/+) larvae after injury and bath infection with A. hydrophila (108 CFU/mL). Recruitment of neutrophils to the site of the injury 1 h after the bacterial infection. Control animals were injured but not infected. 3D reconstruction of a selected site in the infected sample showing the positions of the bacteria (red) inside the neutrophils (green). (B) Relative quantification of neutrophils in the site of injury. Results are representative of three independent experiments (n = 10-15 larvae each; ANOVA; *P < 0.05, **P < 0.01). (C) Expression of IL-1β and TNFα in injured larvae infected by bath immersion (108 CFU/mL) at 1, 3, and 5 hpi. Results of three independent experimental infections (n = 30) expressed as the mean ± standard error (ANOVA and Tukey HSD test; *P < 0.05, **P < 0.01). EXPRESSION / LABELING:
|