
|
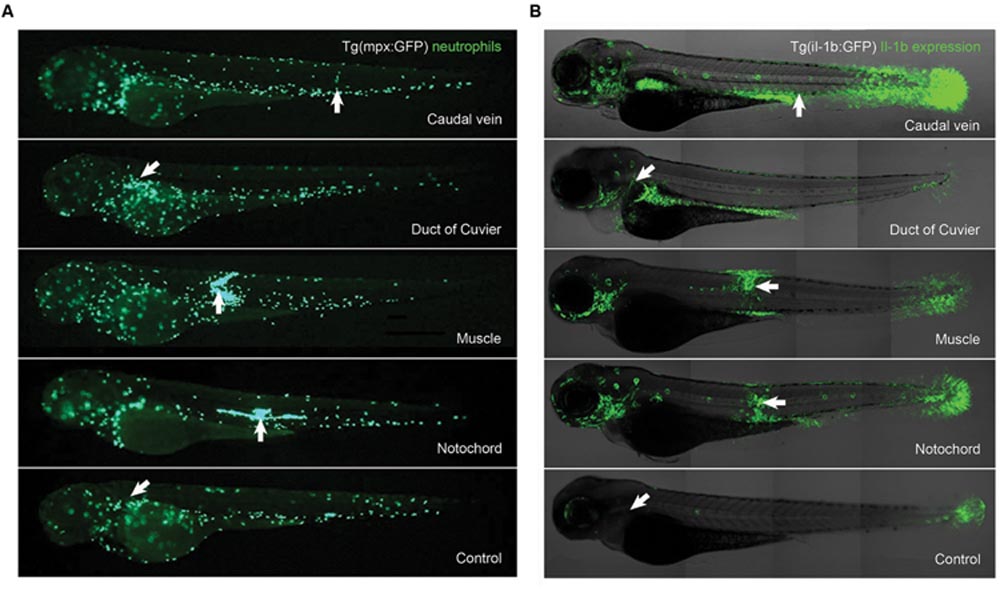
Fig. 2
(A) In vivo imaging of neutrophil migration after infection of Tg(mpx:GFP+/+) larvae with A. hydrophila. Larvae were injected with 1 nL of A. hydrophila (5600 CFU/nL) and imaged at 6 hpi. Images show differential migration of neutrophils depending on the anatomical site of injection. (B) Anatomical distribution of IL-1β gene expression in larvae microinjected at different anatomical sites. Tg(il-1b:GFP+/+) larvae were injected with 1 nL of A. hydrophila (1400 CFU/nL) and imaged at 6 hpi. Overlay of IL1-β expression (green), with the transmission channel used as an anatomical guide. The white arrows indicate the positions of the injection sites.