
- Title
-
Differences in Strength and Timing of the mtDNA Bottleneck between Zebrafish Germline and Non-germline Cells
- Authors
- Otten, A.B., Theunissen, T.E., Derhaag, J.G., Lambrichs, E.H., Boesten, I.B., Winandy, M., van Montfoort, A.P., Tarbashevich, K., Raz, E., Gerards, M., Vanoevelen, J.M., van den Bosch, B.J., Muller, M., Smeets, H.J.
- Source
- Full text @ Cell Rep.
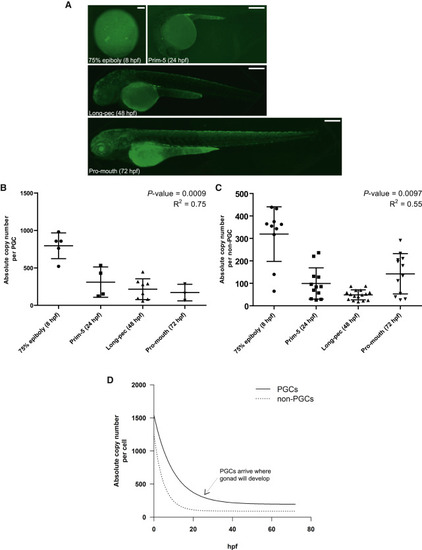
The mtDNA Copy Number in FACS-Isolated PGCs and Non-PGCs from Zebrafish Embryos (A) GFP expression in transgenic zebrafish embryos (EGFP-nanos3 3′ UTR). (A) Embryos were imaged using an Axioplan M1 Zeiss microscope. The images represent a combination of pictures captured along the anterior-posterior axis of the embryo, using specific focal planes. Scale bars represent 100 µm for 8 hpf and 200 µm for 24, 48, and 72 hpf. (B and C) Absolute mtDNA copy number in (B) PGCs and (C) non-PGCs from various stages of development. Every symbol represents one group of 80 cells. Horizontal lines indicate mean with SD. The p values are generated by Spearman’s rank correlation test and indicate a downward trend when <0.05. R2 indicates fitness of a non-linear one-phase decay exponential equation. (D) Plot of the non-linear one-phase decay equation for PGCs (derived from the graph in B) and non-PGCs (derived from C). The half-life was 6.9 hpf for PGCs and 3.4 hpf for non-PGCs. |