
- Title
-
N-cadherin relocalization during cardiac trabeculation
- Authors
- Cherian, A.V., Fukuda, R., Augustine, S.M., Maischein, H.M., Stainier, D.Y.
- Source
- Full text @ Proc. Natl. Acad. Sci. USA
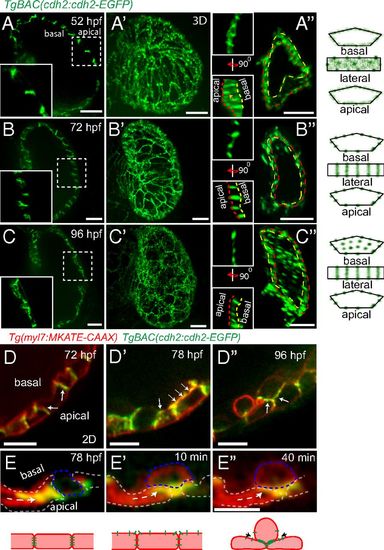
Dynamic distribution of Cdh2-EGFP during cardiac trabeculation. (A-C) 2D and (A′-C′) 3D views of TgBAC(cdh2:cdh2-EGFP) expression during zebrafish heart development, focusing on the ventricular chamber. (A′′-C′′) 3D views of single cardiomyocytes (see also Movies S1-S3); area outlined by yellow dashed lines represents the basal surface of cardiomyocytes and area between yellow and red dashed lines represents their lateral surface; illustration of Cdh2-EGFP distribution in cardiomyocytes. At 52 hpf, Cdh2-EGFP expression appears evenly distributed; by 72 hpf, punctae appear; and by 96 hpf, Cdh2-EGFP expression appears on the basal side of cardiomyocytes. (D-D′′ and E-E′′) TgBAC(cdh2:cdh2-EGFP);Tg(myl7:MKATE-CAAX) expression in developing hearts. Cdh2-EGFP is initially localized at the lateral side of cardiomyocytes (D); it is then also observed on the basal side of cardiomyocytes (D′); and after cardiomyocytes delaminate, it can be observed between compact layer cardiomyocytes and adjacent trabecular cardiomyocytes (D′′); white arrows point to Cdh2-EGFP expression (cartoon representation is shown below). (E-E′′) Redistribution of Cdh2-EGFP to the surface of compact layer cardiomyocytes directly adjacent to trabecular cardiomyocytes. Arrows indicate the apparent movement of Cdh2-EGFP (Movie S5). (Scale bars, 10 µm in A-C, A′-C′, A′′-C′′, and D-D′′; 5 µm in E′′.) |
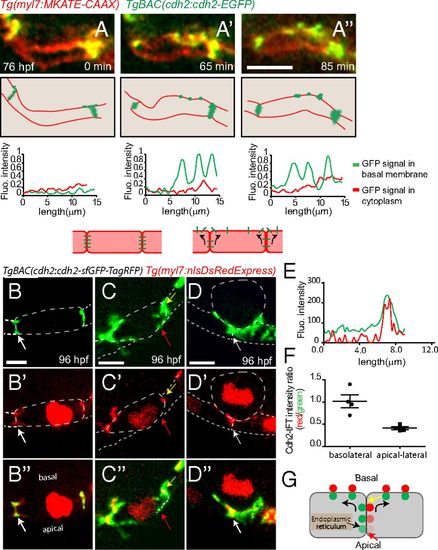
Potential movement of Cdh2-EGFP during cardiac trabeculation. (A-A′′) Spinning disk confocal images of TgBAC(cdh2:cdh2-EGFP);Tg(myl7:MKATE-CAAX) hearts. Cdh2-EGFP appears to relocalize from cell-cell junctions to the basal region of cardiomyocytes, as seen in the single-plane images at different points and depicted in the illustrations here (single-plane images taken from Movie S6). (Bottom) Line scan quantification of Cdh2-EGFP signal in the cytoplasm (red) and basal membrane (green) of cardiomyocytes. (B-D′′) Spinning disk confocal images of TgBAC(cdh2:cdh2-sfGFP-TagRFP);Tg(myl7:nlDsRedExpress) hearts. (B-B′′) Compact layer cardiomyocytes, (C-C′′) delaminating cardiomyocyte, and (D-D′′): delaminated cardiomyocyte; dotted line outlines cardiomyocytes, and the intense red signal in the cytoplasm marks the nucleus. cdh2:Cdh2-tFT expression analysis suggests Cdh2 recruitment to the apical-lateral region of compact layer cardiomyocytes; red arrows in C-C′′ point to an apical-lateral region with newly recruited Cdh2 displaying sfGFP signal without TagRFP signal; white arrows in B-B′′ and D-D′′ point to a region with aged Cdh2 displaying both sfGFP and TagRFP simultaneously. (E) Representative fluorescence intensity distribution of TagRFP and sfGFP in the region depicted by the dotted line in C′′. (F) Scatterplot showing quantification of Cdh2-tFT intensity ratio on the basolateral (yellow arrow in C′′ and G) and apical-lateral (red arrow in C′′ and G) sides of compact layer cardiomyocytes. (G) Diagram depicting hypothetical Cdh2 recruitment to the basal side of the cardiomyocyte plasma membrane from the apical end of cell-cell junctions; the two colors are physically separated for easier visualization. (Scale bars, 5 µm.) |

Cardiac contraction is required for Cdh2-EGFP clustering. Spinning disk confocal images of TgBAC(cdh2:cdh2-EGFP) hearts. Localization of Cdh2-EGFP at 96 hpf in wild-type (A) and stopped hearts using tnnt2a morpholino (B) or 20 mM BDM (C). (D-D′′ and E-E′′) Single plane images at different points. (D-D′′) Cdh2-EGFP in punctae became evenly distributed upon treatment with BDM. (E-E′′) Removal of BDM resulted in the reclustering of Cdh2-EGFP into a punctate pattern. (F-H) Spinning disk confocal images of Tg(myl7:LIFEACT-GFP);Tg(myl7:cdh2-tdTomato) hearts focusing on the basal side of compact layer cardiomyocytes. Red arrows point to colocalization of actin bundle and Cdh2 punctae. On BDM treatment, the association between Cdh2-GFP punctae and actin bundles appears disrupted. (I-K) Dynamics of Cdh2-EGFP localization revealed by fluorescence recovery after photobleaching. (I′′) Recovery of Cdh2-EGFP signal in a 52 hpf heart after photobleaching. (J′′) After photobleaching of Cdh2-EGFP puncta at 96 hpf, it was not able to reform even though a diffuse Cdh2-EGFP signal is observed in the bleached region; zoomed images from bleached region. (K′′) Recovery of Cdh2-EGFP signal in a nonbeating heart at 96 hpf after photobleaching. (Scale bars, 10 µm in A-C, D′′-E′′, and F-H; 5 µm in I′′-K′′.) |

Erbb2 signaling is essential for Cdh2-EGFP localization on the basal side of cardiomyocytes. (A-A′′ and B-B′′) Spinning disk confocal images of TgBAC(cdh2:cdh2-EGFP) hearts. Localization of Cdh2-EGFP in 96 hpf control (wild-type), Erbb2 inhibitor-treated, and erbb2 mutant hearts is shown in the single 2D planes (A-A′′) and 3D reconstructed images (B-B′′). Illustrations of Cdh2-EGFP distribution are shown on the right. (C-C′′) Red, blue, and yellow rectangles shown in the zoomed images are from B-B′′. (D and E) tFT intensity ratio of Cdh2 molecules measured in the regions indicated by the white arrows (E-E′). (F) Schematic diagram depicting Cdh2 localization only at the cell-cell junctions in Erbb2 inhibitor-treated or erbb2 mutant larvae at 96 hpf. (G) Cross-sectional area of Cdh2-EGFP punctae at 96 hpf in DMSO control and Erbb2 inhibitor-treated larvae. (H) Illustration comparing Cdh2 organization in wild-type, stopped, and Erbb2 inhibitor-treated/mutant hearts. (Scale bar: 10 µm in A-A′′, B-B′′, and C-C′′; 5 µm in E and E′.) |
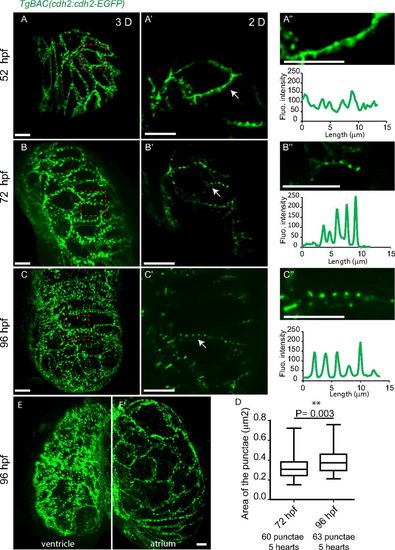
Localization of Cdh2-EGFP expression during heart development. (A-A′′) At 52 hpf, Cdh2-EGFP expression is evenly distributed along the lateral sides of cardiomyocytes with the occasional appearance of punctae. (B-B′′ and C-C′′) punctate pattern of Cdh2-EGFP expression at 72 and 96 hpf (lateral views). (A′-C′) Zoomed images of the regions outlined in the red dashed boxes in A-C. (A′′-C′′) Zoomed images of the regions indicated by the white arrows in A′-C′. (D) Increase in the area of Cdh2-EGFP punctae. (E and E′) As in the ventricle (E), cardiomyocytes in the atrium (E′) show lateral and punctate distribution of Cdh2-EGFP; however, Cdh2-EGFP is not observed on the basal surface of atrial cardiomyocytes at this stage (Movie S4). (Scale bars: 10 µm.) |
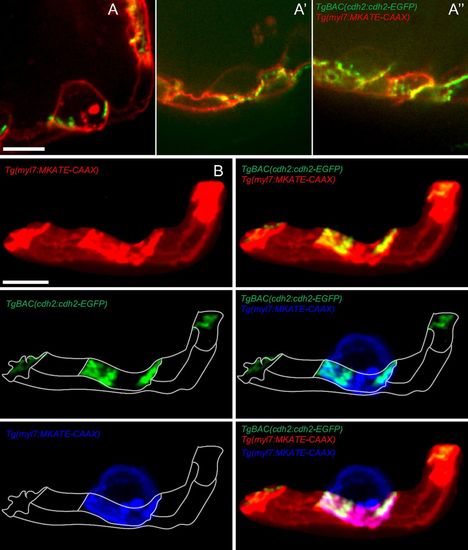
Localization of Cdh2-EGFP during trabeculation. (A-A′′) 2D picture of three different hearts, showing the localization of Cdh2-EGFP molecules during trabeculation. (B) 3D reconstructed images of cardiomyocytes from A. Red, blue, and green colors are used to represent compact cardiomyocytes, trabecular cardiomyocyte (pseudocoloring), and Cdh2-EGFP molecules, respectively. (Scale bars: 10 µm.) |

Localization of Cdh2-EGFP during trabeculation. (A-A′′) 3D projection views of Tg(cmlc2:cdh2-tdTomato) donor-derived cardiomyocytes in a TgBAC(cdh2:cdh2-EGFP) host heart. (C-C′′) Zoomed images of the regions outlined by the white box (B-B′′); white arrow points to Cdh2-EGFP between the trabecular and compact cardiomyocytes (C′′). (Scale bars: 10 µm.) |

Cdh2-EGFP molecules appear to move to the basal region of compact layer cardiomyocytes along the cell membrane. Spinning disk confocal images of a TgBAC(cdh2:cdh2-EGFP);Tg(myl7:MKATE-CAAX) heart. (A) Picture taken from time-lapse Movie S6; line scan quantification of Cdh2-EGFP and MKATE-CAAX; green and red arrows point to the basal and apical sides, respectively. (B′) Zoomed image of the region outlined by white dashed box. (B) Cdh2-EGFP is observed mainly on the cardiomyocyte’s cell membrane, and not in the cytoplasm. (C and C′) Spinning disk confocal images of TgBAC(cdh2:cdh2-sfGFP-TagRFP) cardiomyocytes. cdh2:Cdh2-tFT analysis indicates Cdh2 recruitment to the apical-lateral region of cardiomyocytes; white arrows point to a region with newly recruited Cdh2 displaying sfGFP signal without TagRFP signal. (Scale bar: 10 µm.) |
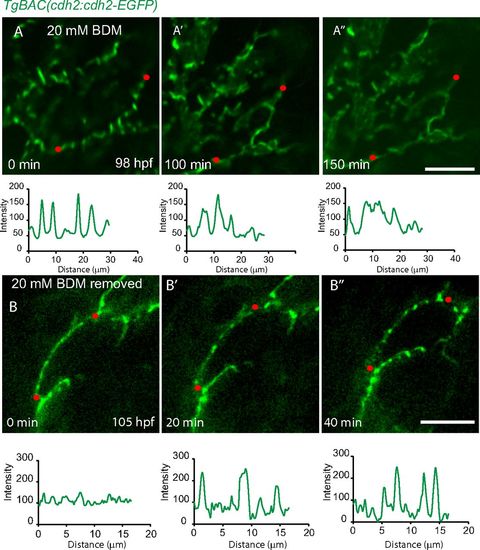
Cardiac contraction is essential for Cdh2 clustering. 2D views of TgBAC(cdh2:cdh2-EGFP) hearts. Line scan quantification of Cdh2-EGFP signal in the region depicted by the red dotted line. (A-A′′) After treatment with BDM, Cdh2-EGFP expression became evenly distributed. (B-B′′) Removal of BDM resulted in the reclustering of Cdh2-EGFP expression into a punctate pattern. (Scale bars: 10 µm.) |

Cardiac contractions are essential for localization of Cdh2 molecules and organization of actin fibers. 3D views of Tg(myl7:LIFEACT-GFP);Tg(myl7:cdh2-tdTomato) hearts. (A and B) Localization of Cdh2 molecules and organization of actin fibers at 52 and 96 hpf; white arrows point to the thick actin bundles. (C) Relocalization of Cdh2 molecules and reorganization of the actin fibers after BDM treatment. (D) Illustration of actin cytoskeleton reorganization under high mechanical force. (Scale bars: 10 µm.) |

Integrity of the cadherin-catenin complex is not affected when cardiac contractions are stopped using BDM. 3D views of Gt(ctnna-citrine);Tg(myl7:cdh2-tdTomato) hearts. Localization of Cdh2 tdTomato and Ctnna1-citrine, (A) control, and (B) after 20 mM BDM treatment. (Scale bar: 10 µm.) |
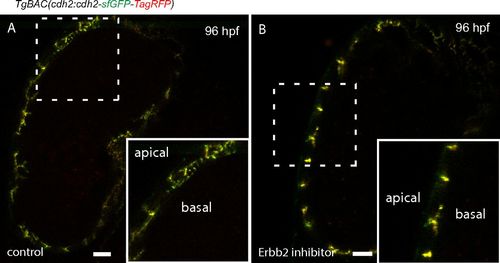
Erbb2 signaling is required for Cdh2-EGFP distribution. (A) Red and green fluorescence sparsely distributed on the basal side of cardiomyocytes (control larva, left), indicating the dynamics of Cdh2-tFT. (B) Cdh2-tFT molecules are colocalized in cell-cell junctions, and thus show a yellow color in Erbb2 inhibitor-treated larva, suggesting the dynamics of Cdh2 are blocked. (Scale bars: 10 µm.) |