
|
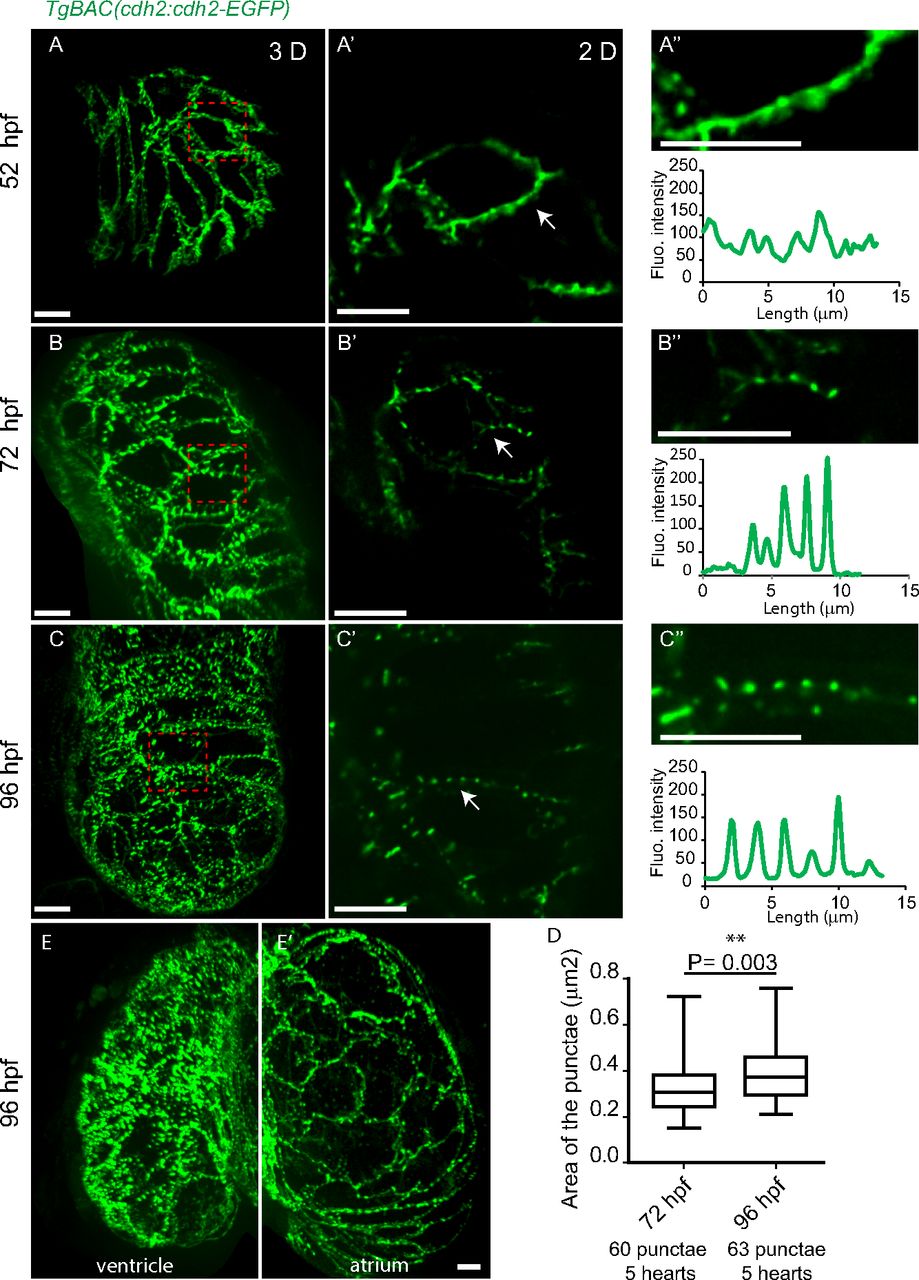
Fig. S1
Localization of Cdh2-EGFP expression during heart development. (A-A′′) At 52 hpf, Cdh2-EGFP expression is evenly distributed along the lateral sides of cardiomyocytes with the occasional appearance of punctae. (B-B′′ and C-C′′) punctate pattern of Cdh2-EGFP expression at 72 and 96 hpf (lateral views). (A′-C′) Zoomed images of the regions outlined in the red dashed boxes in A-C. (A′′-C′′) Zoomed images of the regions indicated by the white arrows in A′-C′. (D) Increase in the area of Cdh2-EGFP punctae. (E and E′) As in the ventricle (E), cardiomyocytes in the atrium (E′) show lateral and punctate distribution of Cdh2-EGFP; however, Cdh2-EGFP is not observed on the basal surface of atrial cardiomyocytes at this stage (Movie S4). (Scale bars: 10 µm.)