
- Title
-
Identification of a Paralog-Specific Notch1 Intracellular Domain Degron
- Authors
- Broadus, M.R., Chen, T.W., Neitzel, L.R., Ng, V.H., Jodoin, J.N., Lee, L.A., Salic, A., Robbins, D.J., Capobianco, A.J., Patton, J.G., Huppert, S.S., Lee, E.
- Source
- Full text @ Cell Rep.
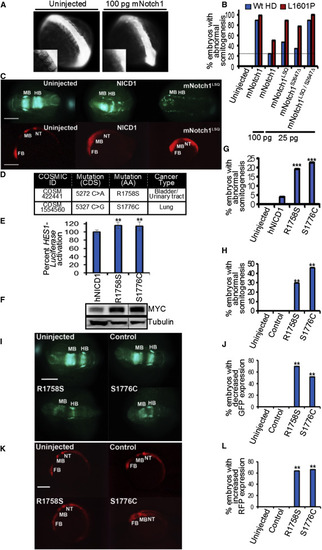
Notch1 N1-Box Mutants Found in Human Cancers Have Increased Activity in Cultured Human Cell and Zebrafish Embryos (A) The N1-Box Notch1 mutant exhibits enhanced capacity to disrupt somitogenesis in embryos. Representative images of 10-13 somite stage zebrafish embryos, uninjected and injected (100 pg of mNotch1 mRNA). Inset is higher magnification. (B) Quantification of zebrafish embryos (10-13 somite stage) with defective somites. Data are from three clutches collected from three different breeding pairs per clutch. n = 78-200 embryos per injection. **p < 0.05 relative to 25 pg Notch1 mRNA injection. ***p < 0.005 relative to 25 pg hNICD1LSQ; S2467Δ mRNA injection, except for comparison to Notch1 100 pg injection (not significant). (C) (Top) Injection into the zebrafish line, Tg[NGN1:GFP], that expresses GFP in primary neurons under control of the ngn1 promoter. Coronal views of embryos at 8× magnification. Embryos with reduced GFP expression: uninjected = 0/44, mNotch1 = 24/32, and mNotch1LSQ = 17/40. Injection of 25 pg. (Bottom) Injection into the zebrafish line, Tg[Her4:dRFP], that expresses RFP under the control of the her4 Notch target gene promoter. Sagittal view of embryos (14 hpf) at 5× magnification. Data are from at least three clutches collected from three different breeding pairs. Embryos with increased RFP expression: uninjected = 0/75, mNotch1 = 60/68, and mNotch1LSQ = 45/53. Injection of 25 pg. Hpf is14 hr post-fertilization. Scale bar, 0.3 mm. (D) Table of somatic mutations found within residues 1754-1788 of hNotch1 (residues 1-35 of hNICD1) from the COSMIC database. (E) Human cancer mutants in the N1-Box expressed in HEK293 cells show elevated HES1-luciferase reporter activity. Graph shows mean ± SD of the luciferase signal normalized to Renilla luciferase of at least three independent experiments performed in triplicate. **p ≤ 0.007 relative to hNICD1. (F) hNotch1 R1758S and S1776C mutants expressed in cultured cells have elevated steady-state levels. Tubulin was used as a loading control. Intervening lanes were removed. (G) Quantification of 10-13 somite stage zebrafish embryos with defective somites (injected with 50 pg of indicated mRNA). Data are from at least three clutches collected from three different breeding pairs. n = 30-320 embryos per injection. ***p < 0.0005 relative to hNICD1. (H) Zebrafish embryos were injected with Cas9 nuclease mRNA, short guide RNA, and donor single-strand oligonucleotides encoding R1758S, S1776C, or Notch1 silent mutation (control). Transgenics expressing the R1758S or S1776C mutation in zebrafish Notch1 exhibit defects in somite formation. In contrast, no somitogenesis defects are observed in transgenics harboring silent mutations of zebrafish Notch1. Graph shows quantification of zebrafish embryos (10-13 somite stage) with defective somites. Number of embryos: uninjected = 210, control = 70, S1776C = 165, and R1758S = 189. (I–L) R1758S and S1776C transgenic mutants exhibit decreased GFP (I) and increased RFP (K) expression in the Tg[NGN1:GFP] and Tg[Her4:dRFP] lines, respectively, when compared to uninjected and Notch1 silent mutant embryos. For Tg[NGN1:GFP] transgenics, coronal views are shown at 8× magnification. Embryos with reduced GFP expression: uninjected = 0/75, control = 0/44, R1758S = 28/40, and S1776C = 16/31. For Tg[Her4:dRFP] transgenics, sagittal views are shown at 5× magnification. Embryos with enhanced RFP expression: uninjected = 0/75, control = 0/30, R1758S = 36/57, and S1776C = 49/74. **p < 0.005 relative to control injected embryos. Scale bar, 0.3 mm. For (J) and (L), graphs show quantification of zebrafish embryos with reduced GFP (J) or enhanced RFP expression (L). Sequencing confirms the presence of the mutations for all affected embryos and the absence of amino acid changes for all non-affected animals. Embryos are 14 hr post-fertilization. FB, forebrain; MB, midbrain; HB, hindbrain; NT, neural tube. See also Figure S3. |
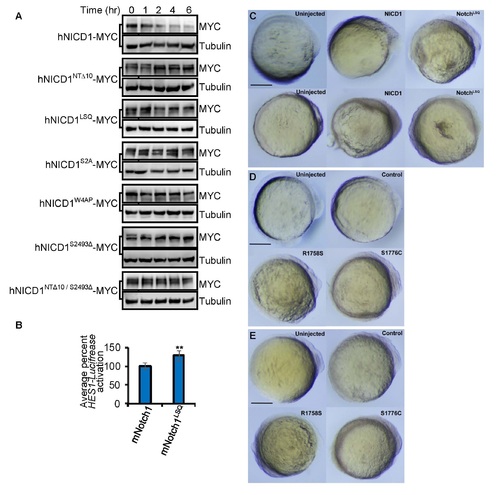
hNICD1 degron mutants have decreased rates of degradation in cultured human cells; related to Figures 2 and 3. (A) MYC-tagged hNICD1, N1-Box mutants (hNICDNTΔ10 and hNICDLSQ), PEST mutants (hNotch1S2A, hNotch1W4AP, and hNICD1S2493Δ) and a combination mutant (hNICD1NTΔ10/S2493Δ) were expressed in HEK293 cells. Cycloheximide (100 µg/ml) was added at 0 min and samples collected at the indicated times for immunoblotting. Tubulin is loading control. (B) Full length mNotch1 or mNotch1 mutants were assessed by HES1- Luciferase Notch reporter activity in HEK293 cells. Luciferase activity was measured after 24 hr. Graph represents the mean ± S.D. of Luciferase signal normalized to Renilla Luciferase of at least 3 independent experiments (performed in triplicate). **p<0.05. (C) Bright field images of zebrafish lines Tg[NGN1:GFP] (top) and Tg[Her4:dRFP] (bottom) injected with indicated mRNAs. Small reduction of posterior structures was observed for both NICD1 and NICD1LSQ injected embryos. Sagittal views of 14 hr post fertilization embryos at 5x magnification are shown. Head is on the right. Scale bar is 0.3 mm. (D-E) Bright field images of transgenic zebrafish lines Tg[NGN1:GFP] (D) and Tg[Her4:dRFP] (E) harboring the R1758S and S1776C mutations that exhibited normal anterior development and minor reduction in posterior structures. Control represents transgenic animals harboring silent mutations of Notch1. Sagittal views of 14 hr post fertilization embryos at 5x magnification are shown. Head is on the right. Scale bar is 0.3 mm. |