
|
Fig. S3
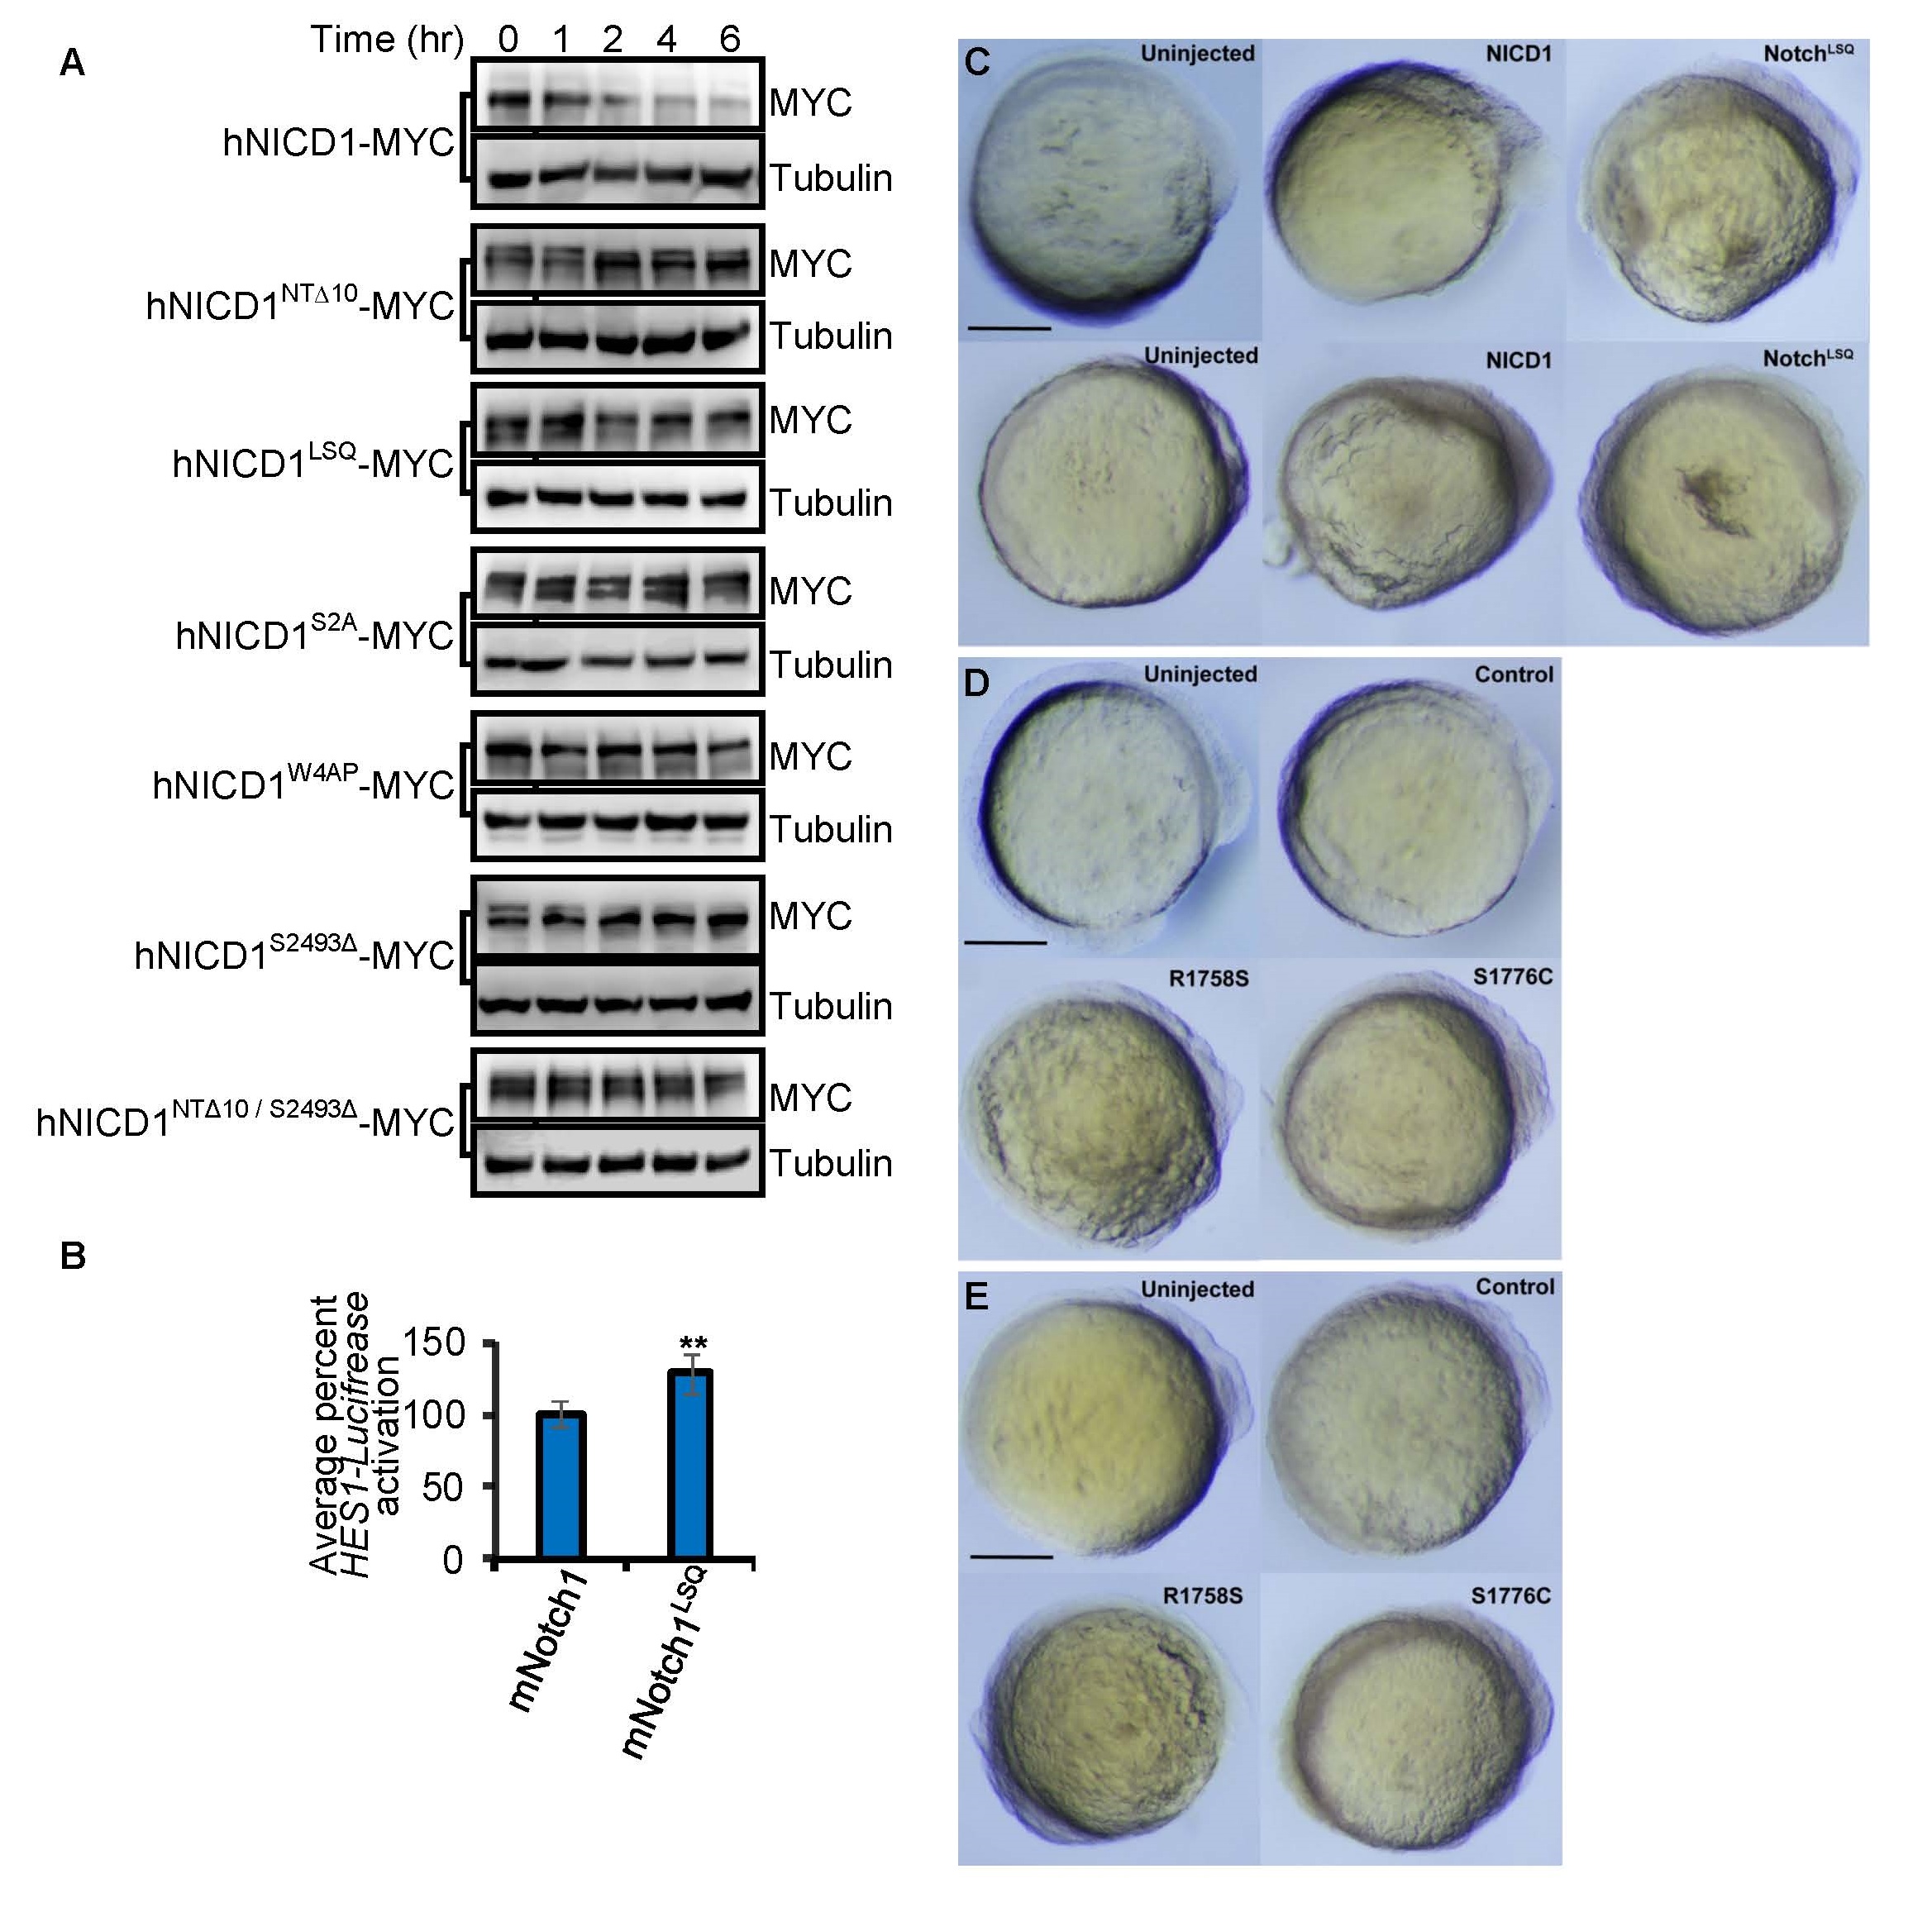
hNICD1 degron mutants have decreased rates of degradation in cultured human cells; related to Figures 2 and 3.
(A) MYC-tagged hNICD1, N1-Box mutants (hNICDNTΔ10 and hNICDLSQ), PEST mutants (hNotch1S2A, hNotch1W4AP, and hNICD1S2493Δ) and a combination mutant (hNICD1NTΔ10/S2493Δ) were expressed in HEK293 cells. Cycloheximide (100 µg/ml) was added at 0 min and samples collected at the indicated times for immunoblotting. Tubulin is loading control.
(B) Full length mNotch1 or mNotch1 mutants were assessed by HES1- Luciferase Notch reporter activity in HEK293 cells. Luciferase activity was measured after 24 hr. Graph represents the mean ± S.D. of Luciferase signal normalized to Renilla Luciferase of at least 3 independent experiments (performed in triplicate). **p<0.05.
(C) Bright field images of zebrafish lines Tg[NGN1:GFP] (top) and Tg[Her4:dRFP] (bottom) injected with indicated mRNAs. Small reduction of posterior structures was observed for both NICD1 and NICD1LSQ injected embryos. Sagittal views of 14 hr post fertilization embryos at 5x magnification are shown. Head is on the right. Scale bar is 0.3 mm.
(D-E) Bright field images of transgenic zebrafish lines Tg[NGN1:GFP] (D) and Tg[Her4:dRFP] (E) harboring the R1758S and S1776C mutations that exhibited normal anterior development and minor reduction in posterior structures. Control represents transgenic animals harboring silent mutations of Notch1. Sagittal views of 14 hr post fertilization embryos at 5x magnification are shown. Head is on the right. Scale bar is 0.3 mm.