
- Title
-
The Cell Nucleus Serves as a Mechanotransducer of Tissue Damage-Induced Inflammation
- Authors
- Enyedi, B., Jelcic, M., Niethammer, P.
- Source
- Full text @ Cell

Osmotic Shock Contributes a Second Signal Required for Ca2+-Dependent cPla2 Activation in Live Zebrafish (A) Left: scheme of experimental setup. Right: working hypothesis for cell swelling-induced pathway of cPLA2 activation. (B) Ratiometric imaging of Ca2+ transients evoked by laser-induced tail fin injury of zebrafish larvae as a function of environmental fluid osmolarity (see also Figure S1 and Movie S1). Larvae are either immersed in hypotonic solution that mimics the osmolarity of their natural habitat (“hypo,” top), or isotonic solution that mimics the osmolarity of their interstitial fluid (“iso,” bottom) to prevent cell swelling after injury. Nuclear GCaMP6s signals are normalized by nuclear mKate2 (mK2) fluorescence using the transgenic Ca2+ reporter larvae Tg(hsp70l:GCaMP6s-NLS-P2A-mK2-NLS). UV-laser wounding was performed at ~1 min. Scale bars, 50 µm. (C) Averaged spatiotemporal profile of Ca2+ signal oscillation frequency of the indicated number of transgenic Ca2+ ratio-reporter larvae, wounded at the indicated times (red arrows) under hypotonic (top) or isotonic conditions (bottom). (D) Spatiotemporal plot of permanent and transient cPla2-mK2 INM-translocation events induced by wounding under hypotonic (top) and isotonic conditions (bottom) in the indicated number of Tg(hsp70l:cPla2-mK2) larvae. (E) Average spatial distribution of cPla2-mK2 translocation events (blue, transient; gray, permanent) and Ca2+ oscillation frequency (orange) as a function of distance from the wound margin, induced by wounding larvae under hypotonic (top) or isotonic (bottom) conditions. Data from experiments shown in (C) and (D). See also Figure S2. |

Osmotic Shock of HeLa Cells Triggers cPla2 Translocation, AA Release, and Nuclear Swelling Counteracted by F-Actin (A) Confocal imaging of cPla2-mK2 in the tail fin of larval zebrafish and HeLa cells, before and after hypotonic exposure (see also Figures S1 and S3). Note the INM-accumulation of cPla2 (white arrow) upon osmotic shock triggered by epithelial wounding of zebrafish in hypotonic bathing solution, or by diluting the cell culture medium of HeLa cells to 150 mOSM. Scale bars, 10 µm. (B) [3H] arachidonic acid release triggered by 10 min hypotonic shock, measured in cPLA2 knock out (k.o.) HeLa cells in the absence (left bars) and presence of heterologous expression of cPla2-mK2. Error bars, SEM; results from eight to ten preparations. ***p < 0.0005, t test. (C) Western blot of wild-type, cPLA2 knock out, and cPla2-mK2-expressing HeLa cells. (D) Parallel, single cell measurements of cPla2-mK2 INM-translocation and cytoplasmic Ca2+ signals, using the calcium indicator dye Fluo4. INM-translocation and Fluo4 signals were scored by automated image analysis. Fluo4 signals were normalized to baseline values and ionomycin-induced maximum signals (see the Experimental Procedures for details). Upper panels, plot of cPla2-mk2 translocation (x axis) as a function [Ca2+] (y axis) in the same cell. Cellular responses were triggered by the purinergic agonist ATP (100 µM) or hypotonicity (150 mOSM) in the absence/presence of latrunculin A (LA) pretreatment as indicated. Gray dots, cells with Ca2+ signals below the critical threshold required for cPla2-mK2 translocation. Black dots, cells above the critical Ca2+-threshold (i.e., 0.3) that do not show cPla2-mK2 translocation. Red dots, cells above the critical Ca2+-threshold showing cPla2-mK2 translocation. The percentage of translocating (red) versus non-translocating cells (black) above the critical Ca2+-threshold is depicted as bar diagram above each plot. This ratio indicates the efficiency of a suprathreshold Ca2+ signal to induce cPla2-mK2 translocation under the respective experimental condition. Lower panels, average [Ca2+]-traces of cells that exhibit cPla2-mK2 translocation during the stimulation. Error bars, SEM; n, number of cells. (E) Average nuclear volume evolution after hypotonic shock in untreated and LA-pretreated HeLa cells, measured by confocal imaging of nuclear targeted EGFP. Error bars, SEM; n, number of cells. |

F-Actin Inhibits cPla2 Translocation and Nuclear Swelling in Live Zebrafish (A) Left: confocal maximum intensity projections of cPla2-mK2 in latrunculin B (LB) pretreated zebrafish larvae, wounded under hypotonic conditions at t = 0.5-1 min. Note the wave of cPla2-mK2 translocation reaching ~200 µm deep into the tissue (see also Movie S4). Scale bars, 50 and 10 µm. Right: quantification of cPla2-mK2 translocation (see the Experimental Procedures for details) in selected nuclei, marked with rainbow color masks (A-F) on the left panel. (B) Averaged spatiotemporal profile of Ca2+ signal oscillation frequency of the indicated number of transgenic Ca2+ ratio-reporter larvae, pretreated with latrunculin B (LB) and wounded at the indicated time under hypotonic conditions. (C) Spatiotemporal plot of permanent and transient cPla2-mK2 INM-translocation events induced by wounding under hypotonic conditions after LB-pretreatment in the indicated number of Tg(hsp70l:cPla2-mK2) larvae. (D) Average spatial distribution of cPla2-mK2 translocation events (blue, transient; gray, permanent) and Ca2+ oscillation frequency (orange) as a function of distance from the wound margin, induced by wounding LB-pretreated larvae under hypotonic conditions (data from experiments shown in B and C). (E) Average nuclear volume evolution in the suprabasal and basal epithelial cells of zebrafish tail fin after hypotonic shifting in untreated and LB-pretreated larvae, measured by confocal imaging of nuclear targeted EGFP. Error bars, SEM; n, number of cells. |

Swollen Nuclei that Contain cPla2 Attract Leukocytes to Cell Corpses (A) Left: scheme of experimental design. Amputated zebrafish larvae were immersed in isotonic bathing solution to inhibit endogenous, wound-induced inflammation. Amputation wounds were exposed to differently conditioned HeLa cell suspensions. Nuclear swelling was initiated by digitonin-permeabilization and blocked by PVP-supplementation as described. Right: average number of leukocytes recruited to the wound margin within 60 min after cell-exposure of amputated tail fins at indicated conditions (table). Note that only swollen (condition 5), but not nonswollen nuclei (conditions 3 and 4) that contain cPla2-mK2 attract leukocytes to cell corpses at permissive [Ca2+]. Error bars, SEM. ***p < 0.0005, t test. n, number of animals. (B) Transmitted light images of zebrafish larvae exposed to permeabilized cell corpses with nonswollen (top, condition 4) or swollen (bottom, condition 5) nuclei that contain cPla2-mK2. Representative leukocyte tracks are superimposed and color-coded. Please refer to the Experimental Procedures for details. Scale bars, 100 µm. |

Spatiotemporal Mapping of Wound-Induced Ca2+ Signals and cPla2 Translocation in Live Zebrafish, Related to Figures 1 and 2 (A) Average spatiotemporal Ca2+ signal profile of the indicated number of transgenic Ca2+ reporter larvae Tg(hsp70l: GCaMP6s-NLS-P2A-mK2-NLS) after wounding in hypotonic (left) or isotonic (right) solution. (B) Top panels, representative confocal images showing cPla2-mK2 localization in Tg(hsp70l:cPla2-mK2) larvae after laser-wounding (wound margin marked by red dashed line) under hypotonic (left) or isotonic (right) conditions. Bottom panel, quantification of cPla2-mK2 INM translocation state in the cells selected at various distances from the wound margin. |

Osmotic Cell Swelling and Ca2+ Signals Are Required for cPla2 Activation in Live Zebrafish, Related to Figure 1 (A) Left, scheme of experimental setup. Right, ratiometric imaging of Ca2+ transients induced by stimulation of amputated tail fins with the Ca2+-ionophore ionomycin in hypotonic (top) or isotonic (bottom) bathing solution (also see Movie S2). To allow drug penetration, tail fin tips were amputated under isotonic conditions ~10 min in advance. Scale bars, 50 µm. (B) Average spatiotemporal Ca2+ signal profile of the indicated number of transgenic Ca2+ reporter larvae Tg(hsp70l:GCaMP6s-NLS-P2A-mK2-NLS) after ionomycin stimulation in hypotonic solution (see A, “hypo,” top). (C) Spatiotemporal plot of permanent cPla2-mK2 INM-translocation events induced by ionomycin treatment at the indicated time under hypotonic conditions in the indicated number of Tg(hsp70l:cPla2-mK2) larvae. Dotted ellipse, corresponding regions in plots B and C. (D) Representative confocal images showing cPla2-mK2 localization in transgenic zebrafish larvae before and after ionomycin stimulation under hypotonic (top) or isotonic (bottom) conditions, at a site ~150 µm from the wound margin (see also Movie S3). White arrows, INM-translocation of cPla2-mK2. Scale bars, 10 µm. (E) Left panel, representative confocal images showing cPla2-mK2 localization of cells at the indicated distances from the wound margin in Tg(hsp70l:cPla2-mK2) larvae treated with ionomycin under hypotonic conditions at the indicated time. Right panel, quantification of cPla2-mK2 translocation (see Experimental Procedures for details). Scale bars, 10 µm. (F) Confocal imaging of Tg(hsp70l:cPla2-mK2) zebrafish larvae before and after ionomycin stimulation under hypotonic (top) or isotonic (bottom) conditions, focusing on the fibroblast-like mesenchymal cells ~150 µm from the wound margin. Note the translocation of cPla2-mK2 to the nuclear envelope in the upper right panel as marked by white arrows. Scale bars, 10 µm. (G) Confocal imaging of Ca2+ signals triggered by ionomycin under hypotonic or isotonic conditions in Tg(hsp70l:GCaMP6s-NLS-P2A-mK2-NLS) zebrafish larvae after tail fin tip amputation. A segment of the tail fin similar to the one in F is enlarged, showing fibroblast-like mesenchymal cells before and after the ionomycin-induced Ca2+ wave reaches this region. Scale bars, 10 µm. |
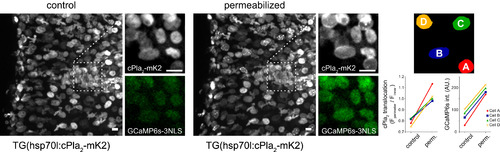
Cell Permeabilization Triggers INM Translocation of cPla2-mK2 in Zebrafish Larvae Irrespective of Bathing Osmolarity, Related to Figure 5 Left panel, confocal imaging of cPla2-mK2 localization and nuclear Ca2+ levels with GCaMP6s before and after digitonin-induced permeabilization of zebrafish larvae, bathed in isotonic medium. Note the translocation of cPla2 and the increase in [Ca2+] after permeabilization. Right panel, quantification of cPla2-mK2 INM translocation and average GCaMP6s fluorescence before and after permeabilization in the selected nuclei marked by rainbow colored masks (A-D). Scale bars, 10 µm. |
Reprinted from Cell, 165, Enyedi, B., Jelcic, M., Niethammer, P., The Cell Nucleus Serves as a Mechanotransducer of Tissue Damage-Induced Inflammation, 1160-1170, Copyright (2016) with permission from Elsevier. Full text @ Cell